Free Reinforced Concrete Column P-M Interaction Diagram Generator. Step-by-step, engineering-grade tool with downloadable report.

This template is not available yet. You can sign up and create it yourself!
Or let us know if you'd like to be notified when it’s ready:
No items found.
No items found.
About this P M interaction diagram calculator
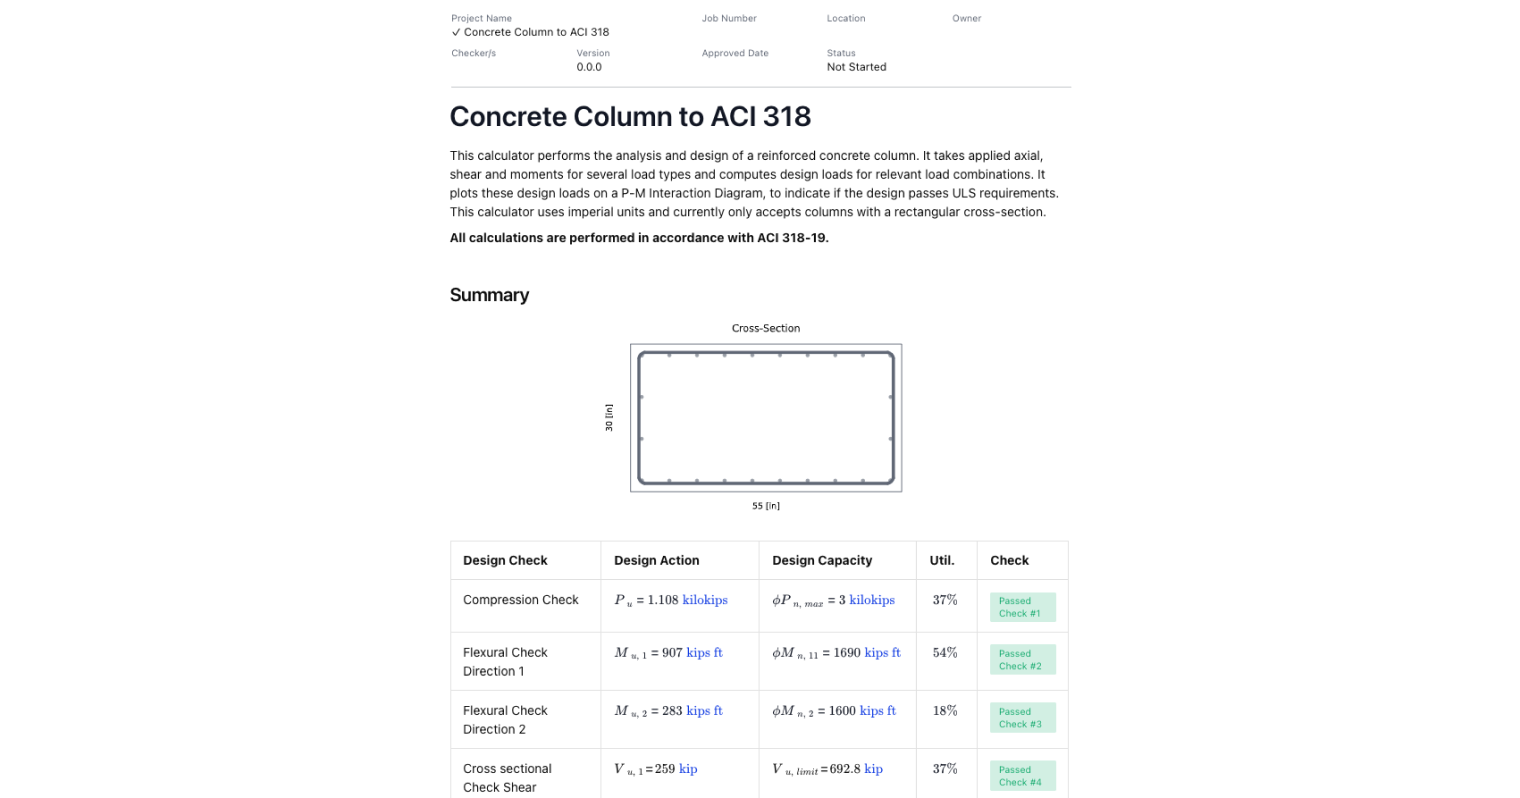
This calculator generates a P-M interaction diagram for reinforced concrete columns, allowing engineers to evaluate axial load and bending moment capacity under combined actions. It provides a graphical representation of the relationship between axial loads and bending moments for structural design verification. It’s built for structural engineers, especially those working with reinforced concrete design in compliance with standards like ACI 318.
- Structural Engineers: Use this calculator to evaluate the capacity of reinforced concrete sections under combined loading conditions and ensure compliance with design codes.
- Design Professionals: Apply this tool to assess column performance and optimize reinforcement configurations for safe and efficient structural members.
- Civil Engineering Students and Educators learning about the interplay between axial loads and moments in concrete column behavior.
Whether you're designing a column under combined axial and bending loads or checking an existing design for capacity, this generator outputs the full interaction diagram, balance point, and key parameters like neutral axis depth, strain compatibility, and steel yields.
You can simulate pure compression, pure moment, or transition zone scenarios. The tool supports both symmetrical and asymmetrical reinforcement configurations.
For an in-depth review on P-M interaction diagrams, please refer to: Interaction Diagram for Concrete Columns: Comparing ACI 318-19 and AS 3600 Approaches
General info on Reinforced Concrete Column P-M Interaction Calculations
Strain Compatibility and Stress Distribution
The calculator uses strain compatibility across the section to determine the neutral axis and associated stress distribution. The maximum compressive strain is set at the extreme concrete compression fiber, while yield strain limits are used for reinforcing steel.
The equivalent rectangular stress block method is applied to simulate concrete behavior under compression. Tensile strain is tracked in reinforcement, considering whether tension steel has yielded or not.
Transition Zones and Balance Point
The transition zone on a P-M diagram refers to the range where neither the concrete nor the steel has fully yielded. Within this region, both steel strain and bar stress must be evaluated precisely.
The balance point is critical: it occurs when the compression controlled strain limit is reached in concrete while steel is just yielding in tension. Beyond this point, the behavior switches between compression controlled and tension controlled failure modes.
PM Interaction Curve Development
To build the P-M interaction curve, the tool sweeps the neutral axis depth across its full range—from deep inside the compression zone (for maximum axial load) to the opposite extreme, where maximum tension develops in the reinforcement.
Each stage calculates:
- Axial force (P)
- Bending moment (M)
- Steel yields check
- Location of the neutral axis
- Reinforcement stress and moment capacity
Want to learn more? See: Interaction Diagram for Concrete Columns: Comparing ACI 318-19 and AS 3600 Approaches
Common Calculation Errors to Avoid
Engineers must be precise when generating a p m interaction diagram. Here are common pitfalls:
- Ignoring strain compatibility: A valid interaction diagram must account for simultaneous tension and compression strain behavior across the section.
- Wrong stress block assumptions: Ensure the equivalent rectangular stress block is applied correctly, especially near the transition zone.
- Forgetting pure edge cases: Including pure compression, pure moment, and pure axial tension points improves curve accuracy.
- Incorrect reinforcement layout: Symmetrical vs asymmetrical reinforcing steel affects the neutral axis and curve shape.
- Misidentifying failure modes: Know when the section is compression controlled, tension controlled, or at balanced failure.
Engineering templates
Common calculators
Design guides
FAQs
What is a P-M Interaction Diagram?
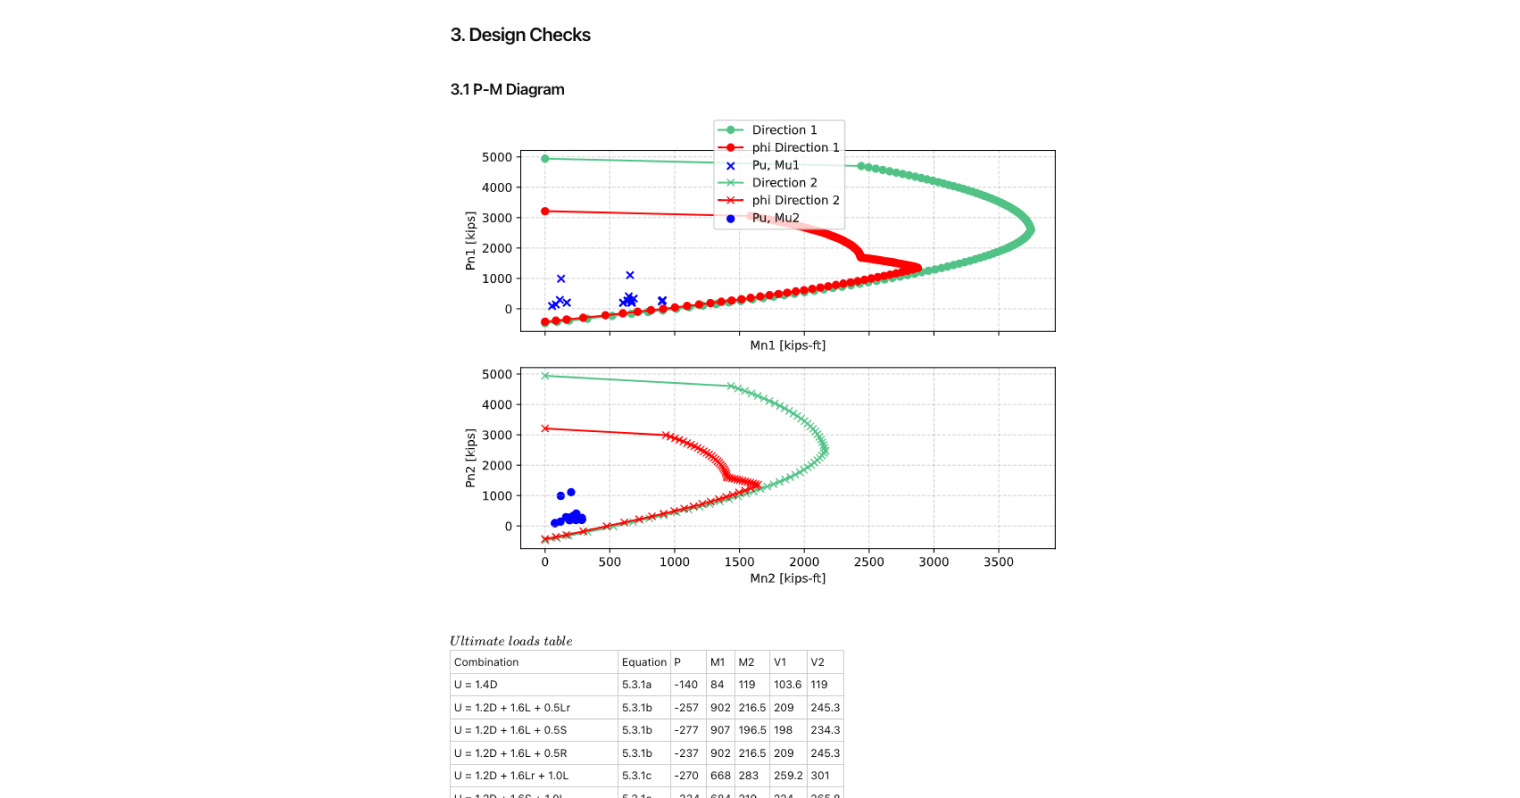
A P-M interaction diagram (or interaction curve) maps the capacity of a reinforced concrete section to resist combinations of axial load (P) and bending moment (M). It defines the limits beyond which the structural member fails due to compression, tension, or a balanced failure.
Each point on the interaction curve corresponds to a unique strain distribution, from pure compression to pure axial tension or pure moment. It helps visualize how changes in loading impact safety and performance.
What is the PM interaction?
P-M interaction refers to how axial force and bending moment affect each other in a reinforced concrete column.
How to create a PM interaction diagram?
To create a p m interaction diagram, you:
- Sweep the neutral axis across the section.
- Apply strain compatibility to determine concrete and steel stresses.
- Sum internal forces to compute axial load and moment.
- Plot these to form the interaction curve.
This is automated in this calculation template.
Can this handle both strong axis and weak axis directions?
This tool evaluates both cases separately and can simulate loading in both directions simultaneously if your design requires it.
Summary and References
This tool streamlines the process of generating a P-M interaction diagram for reinforced concrete columns. By incorporating strain limits, section geometry, material properties, and reinforcing layout, it captures all critical behaviors from pure compression to pure moment.
Useful for engineers designing to ACI standards or verifying column strength under external loads and unbalanced moments, the tool simplifies a complex task into a transparent, repeatable workflow.
References:
- Interaction Diagram for Concrete Columns: Comparing ACI 318-19 and AS 3600 Approaches
- ACI 318-19: Building Code Requirements for Structural Concrete


Learn about the benefits of using CalcTree on engineering projects!