
Four terrain roughness methods compared in Python on one landslide: rugosity, TPI, fractal dimension and wavelet power, mapped side by side. Open a copy.

Tell us what you need, or sign up and build it yourself in minutes.
Leave your email and we'll tell you when a template for it is ready:





No items found.
No items found.
About this Terrain Roughness Comparison
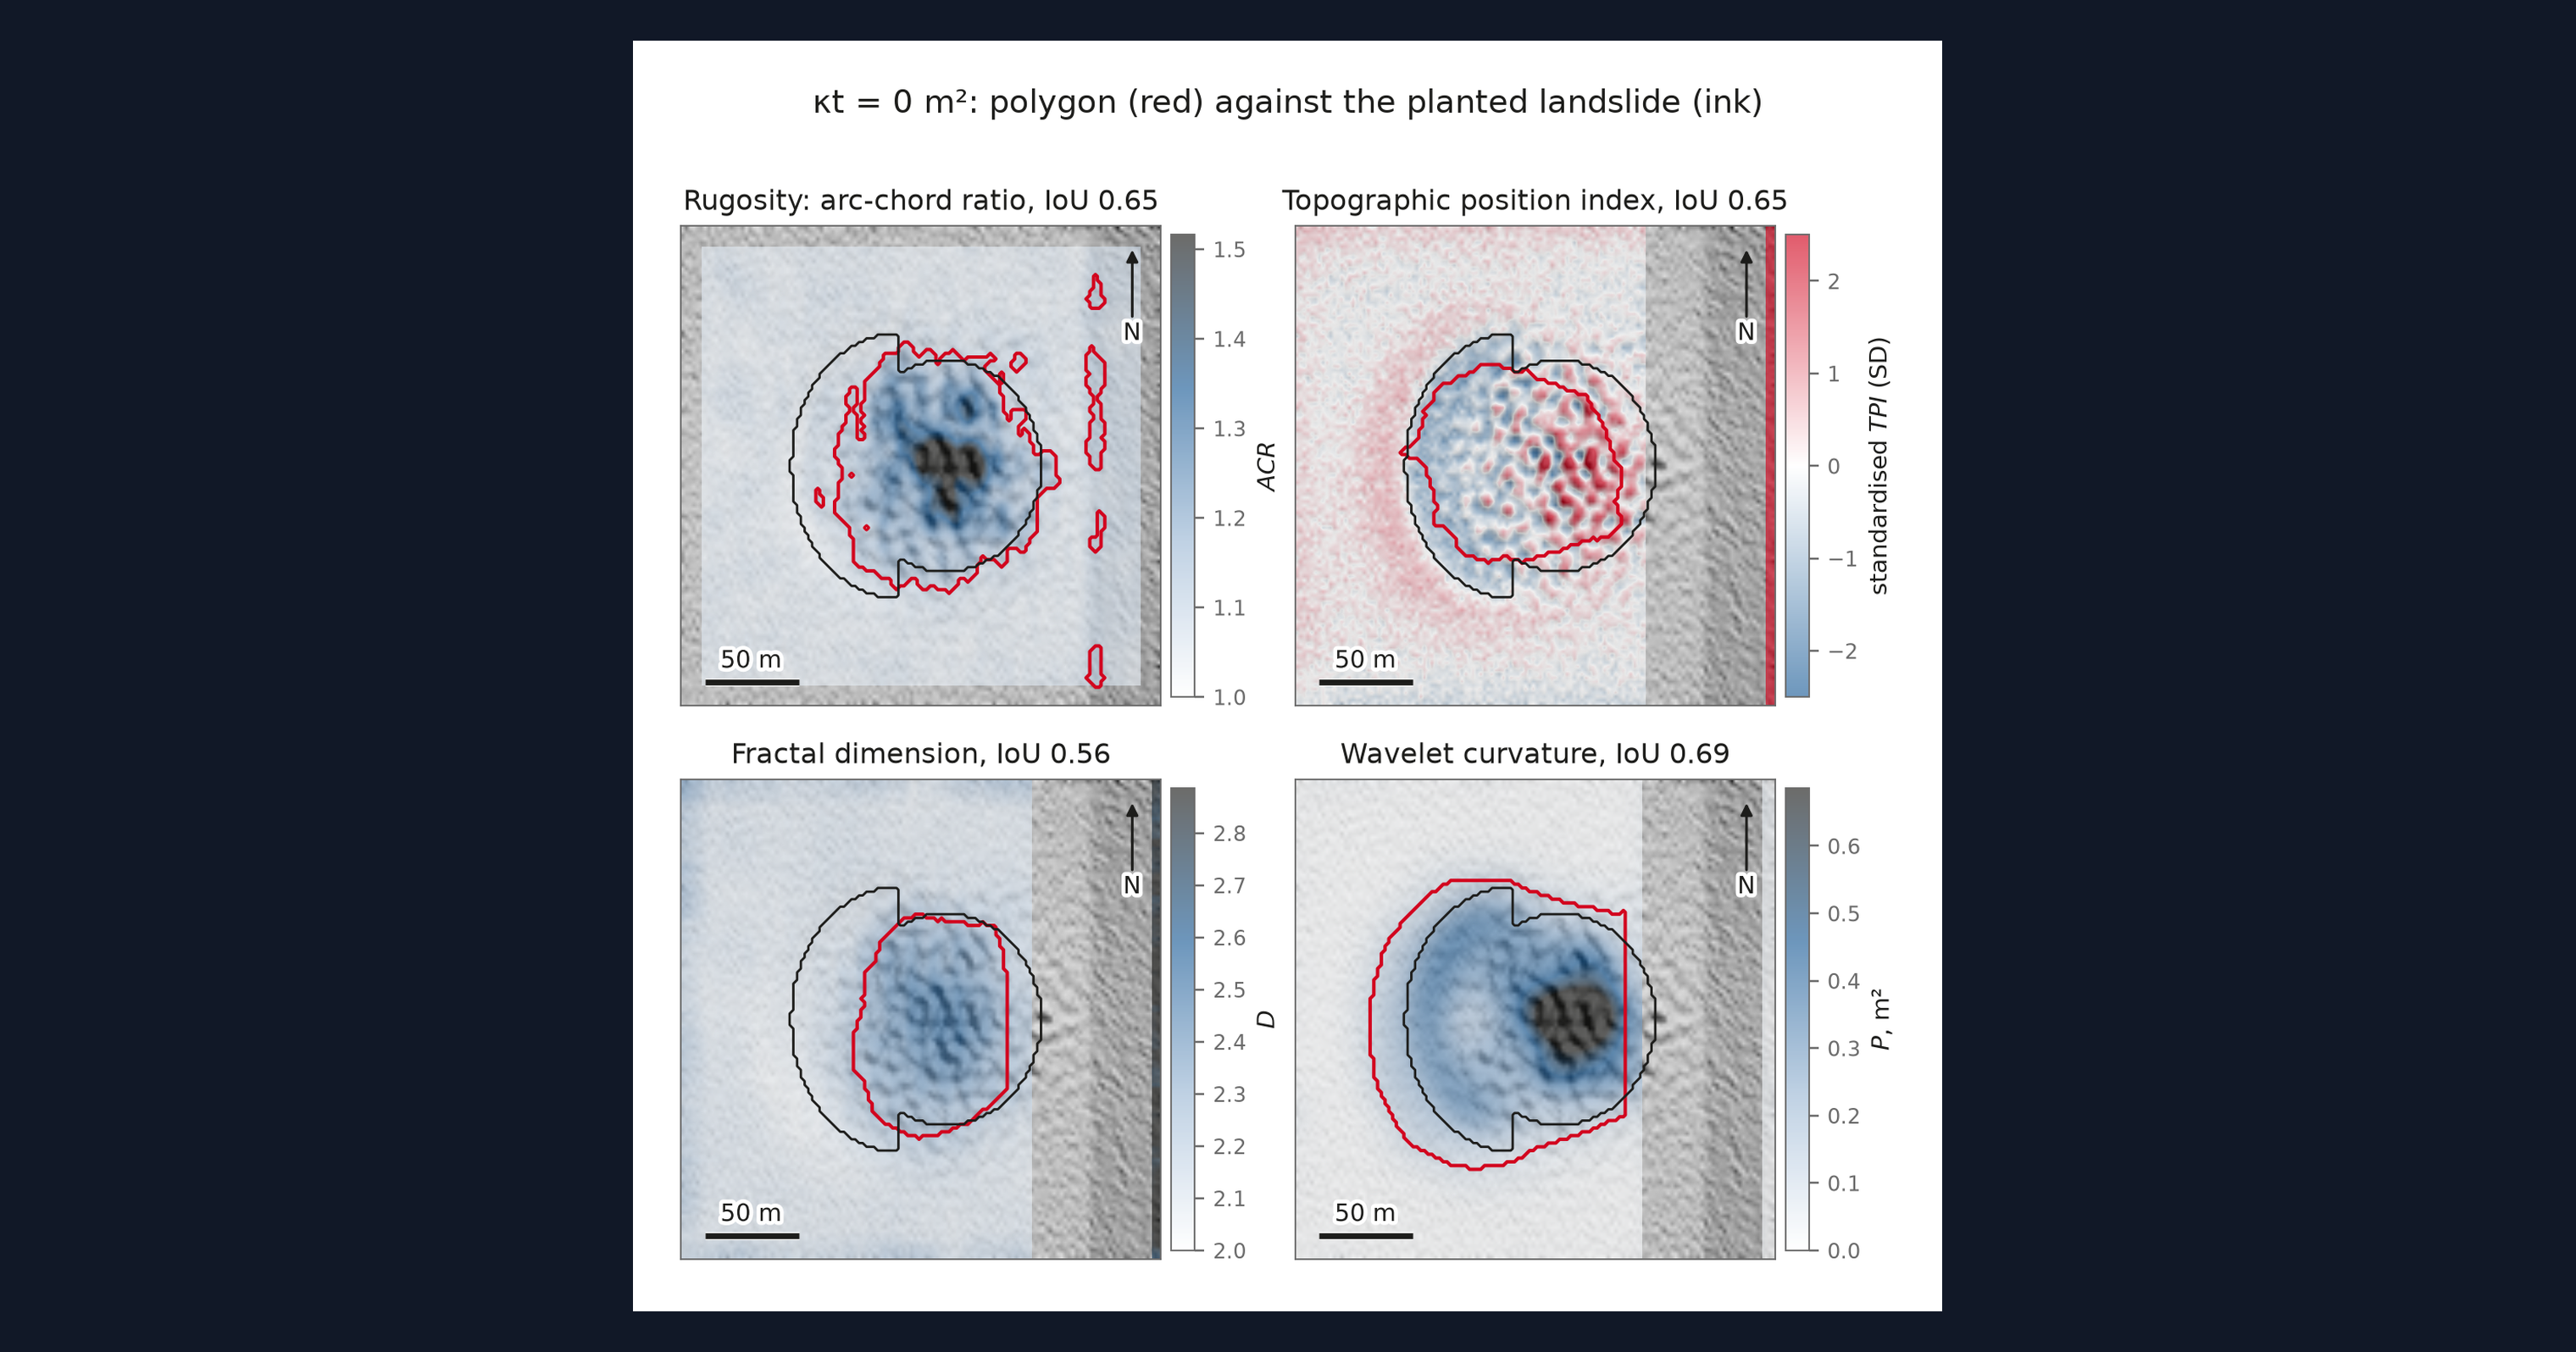
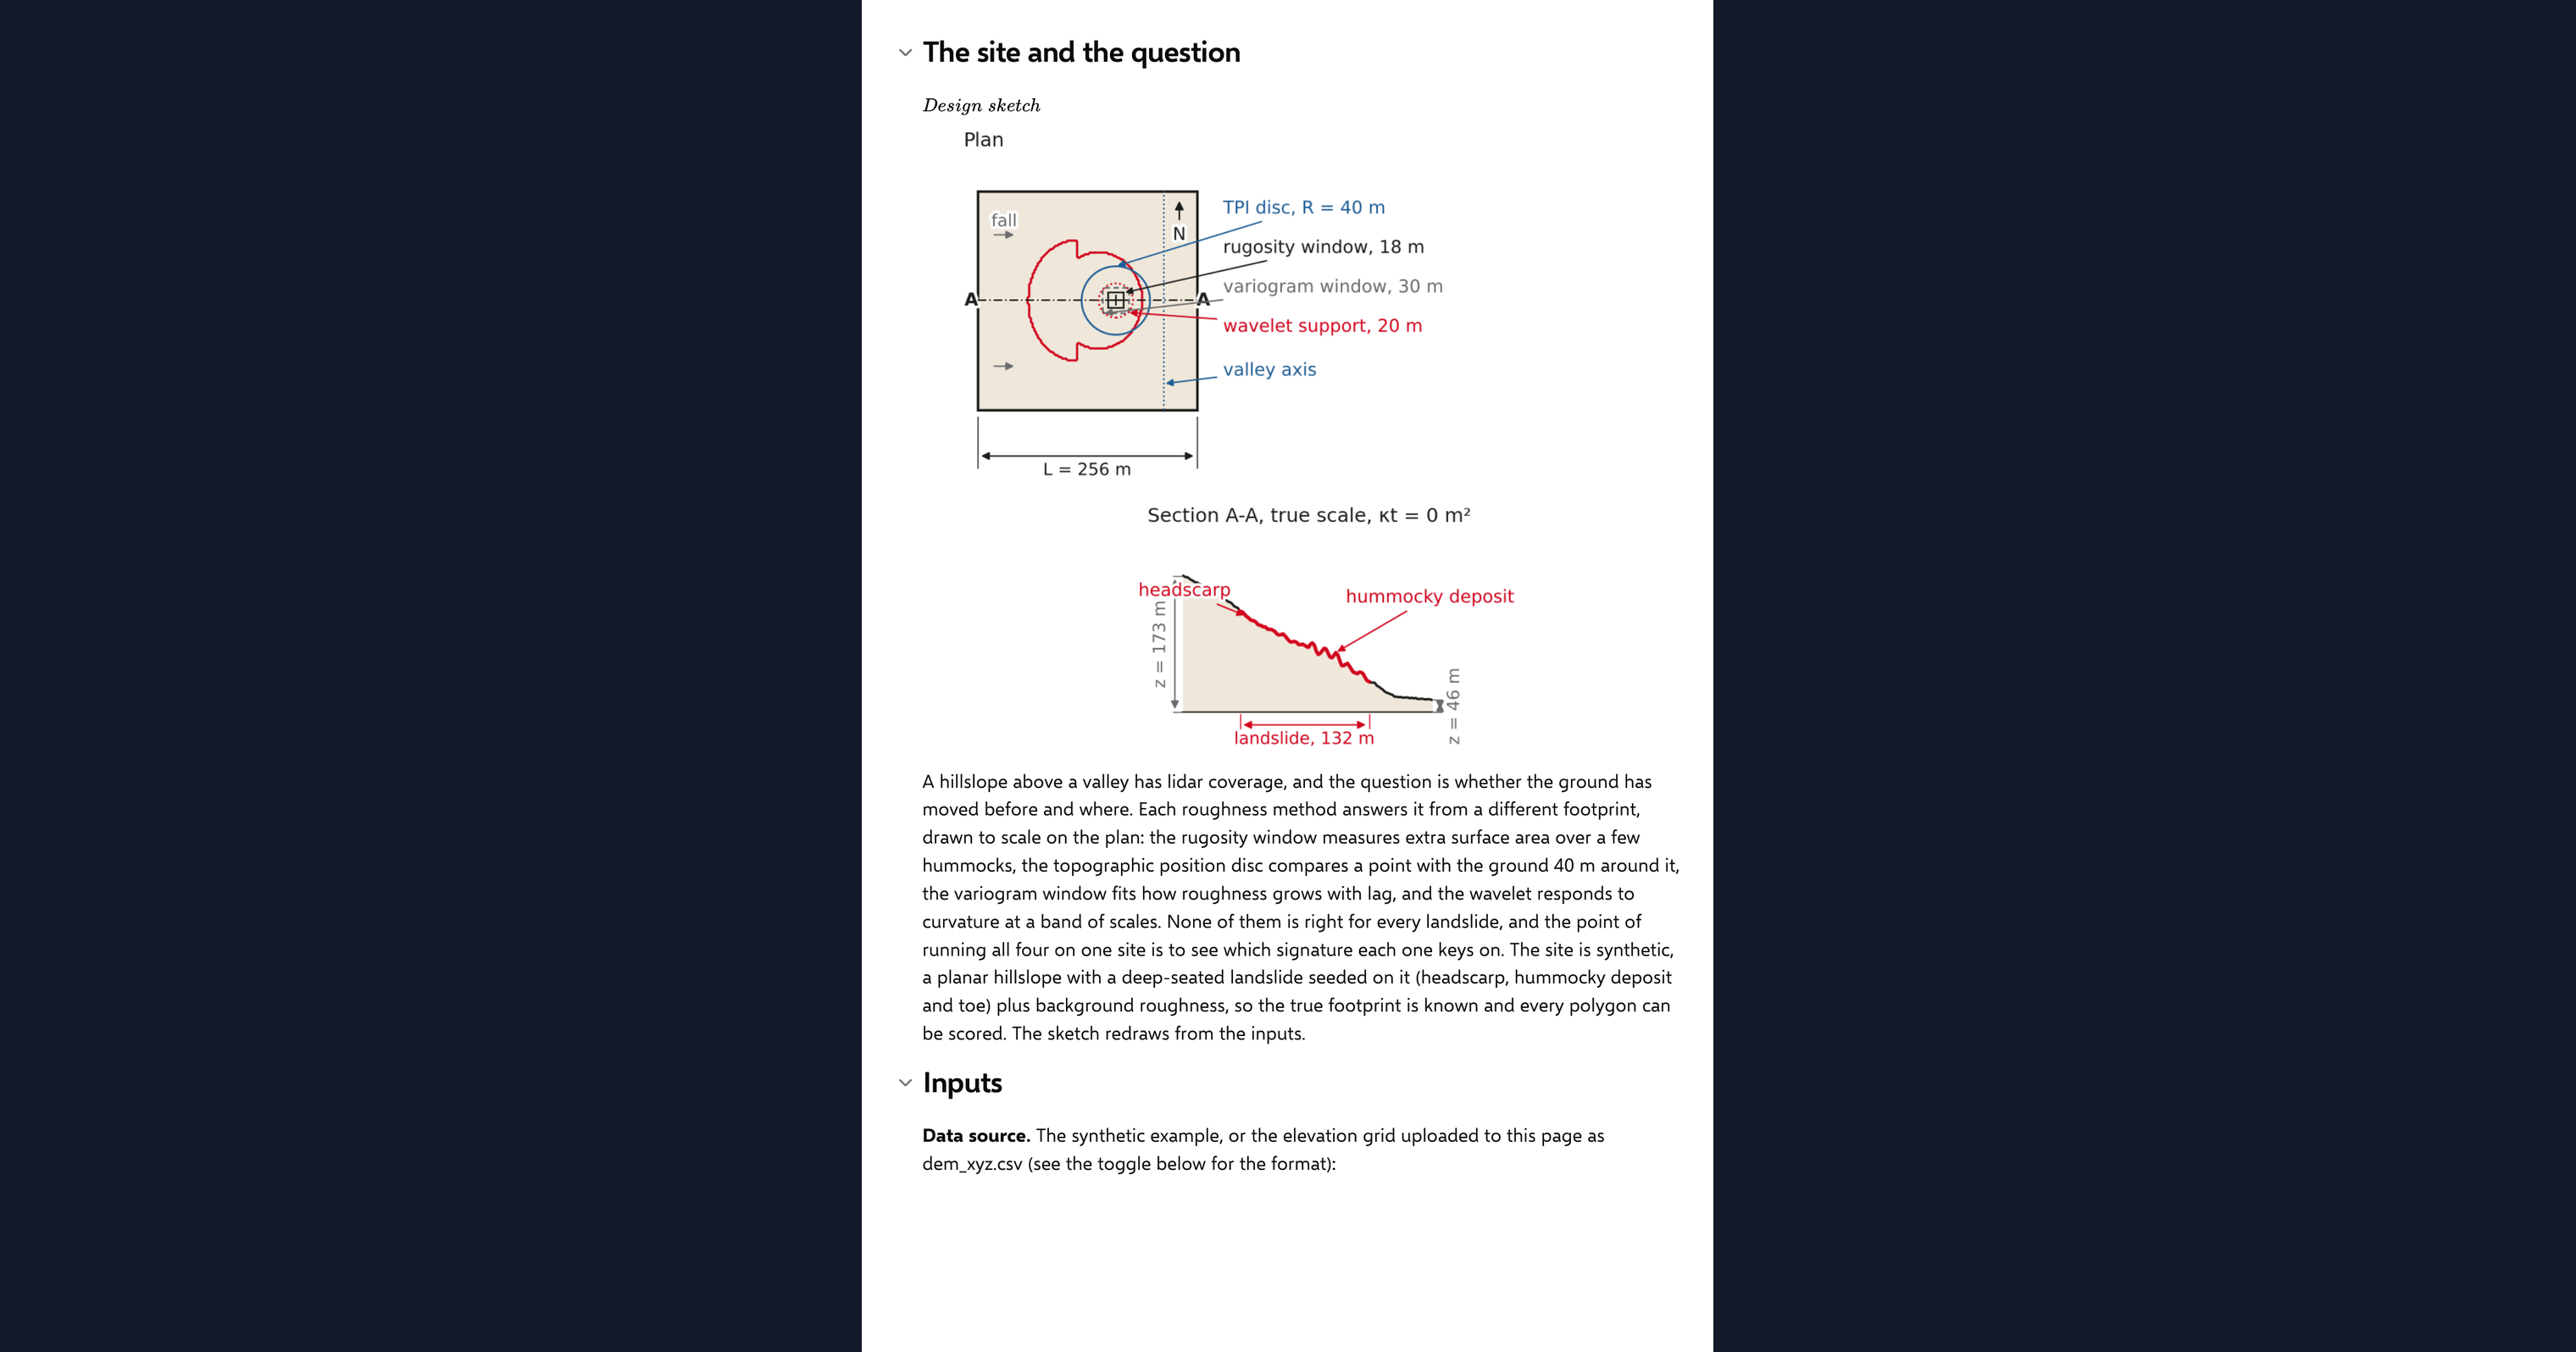
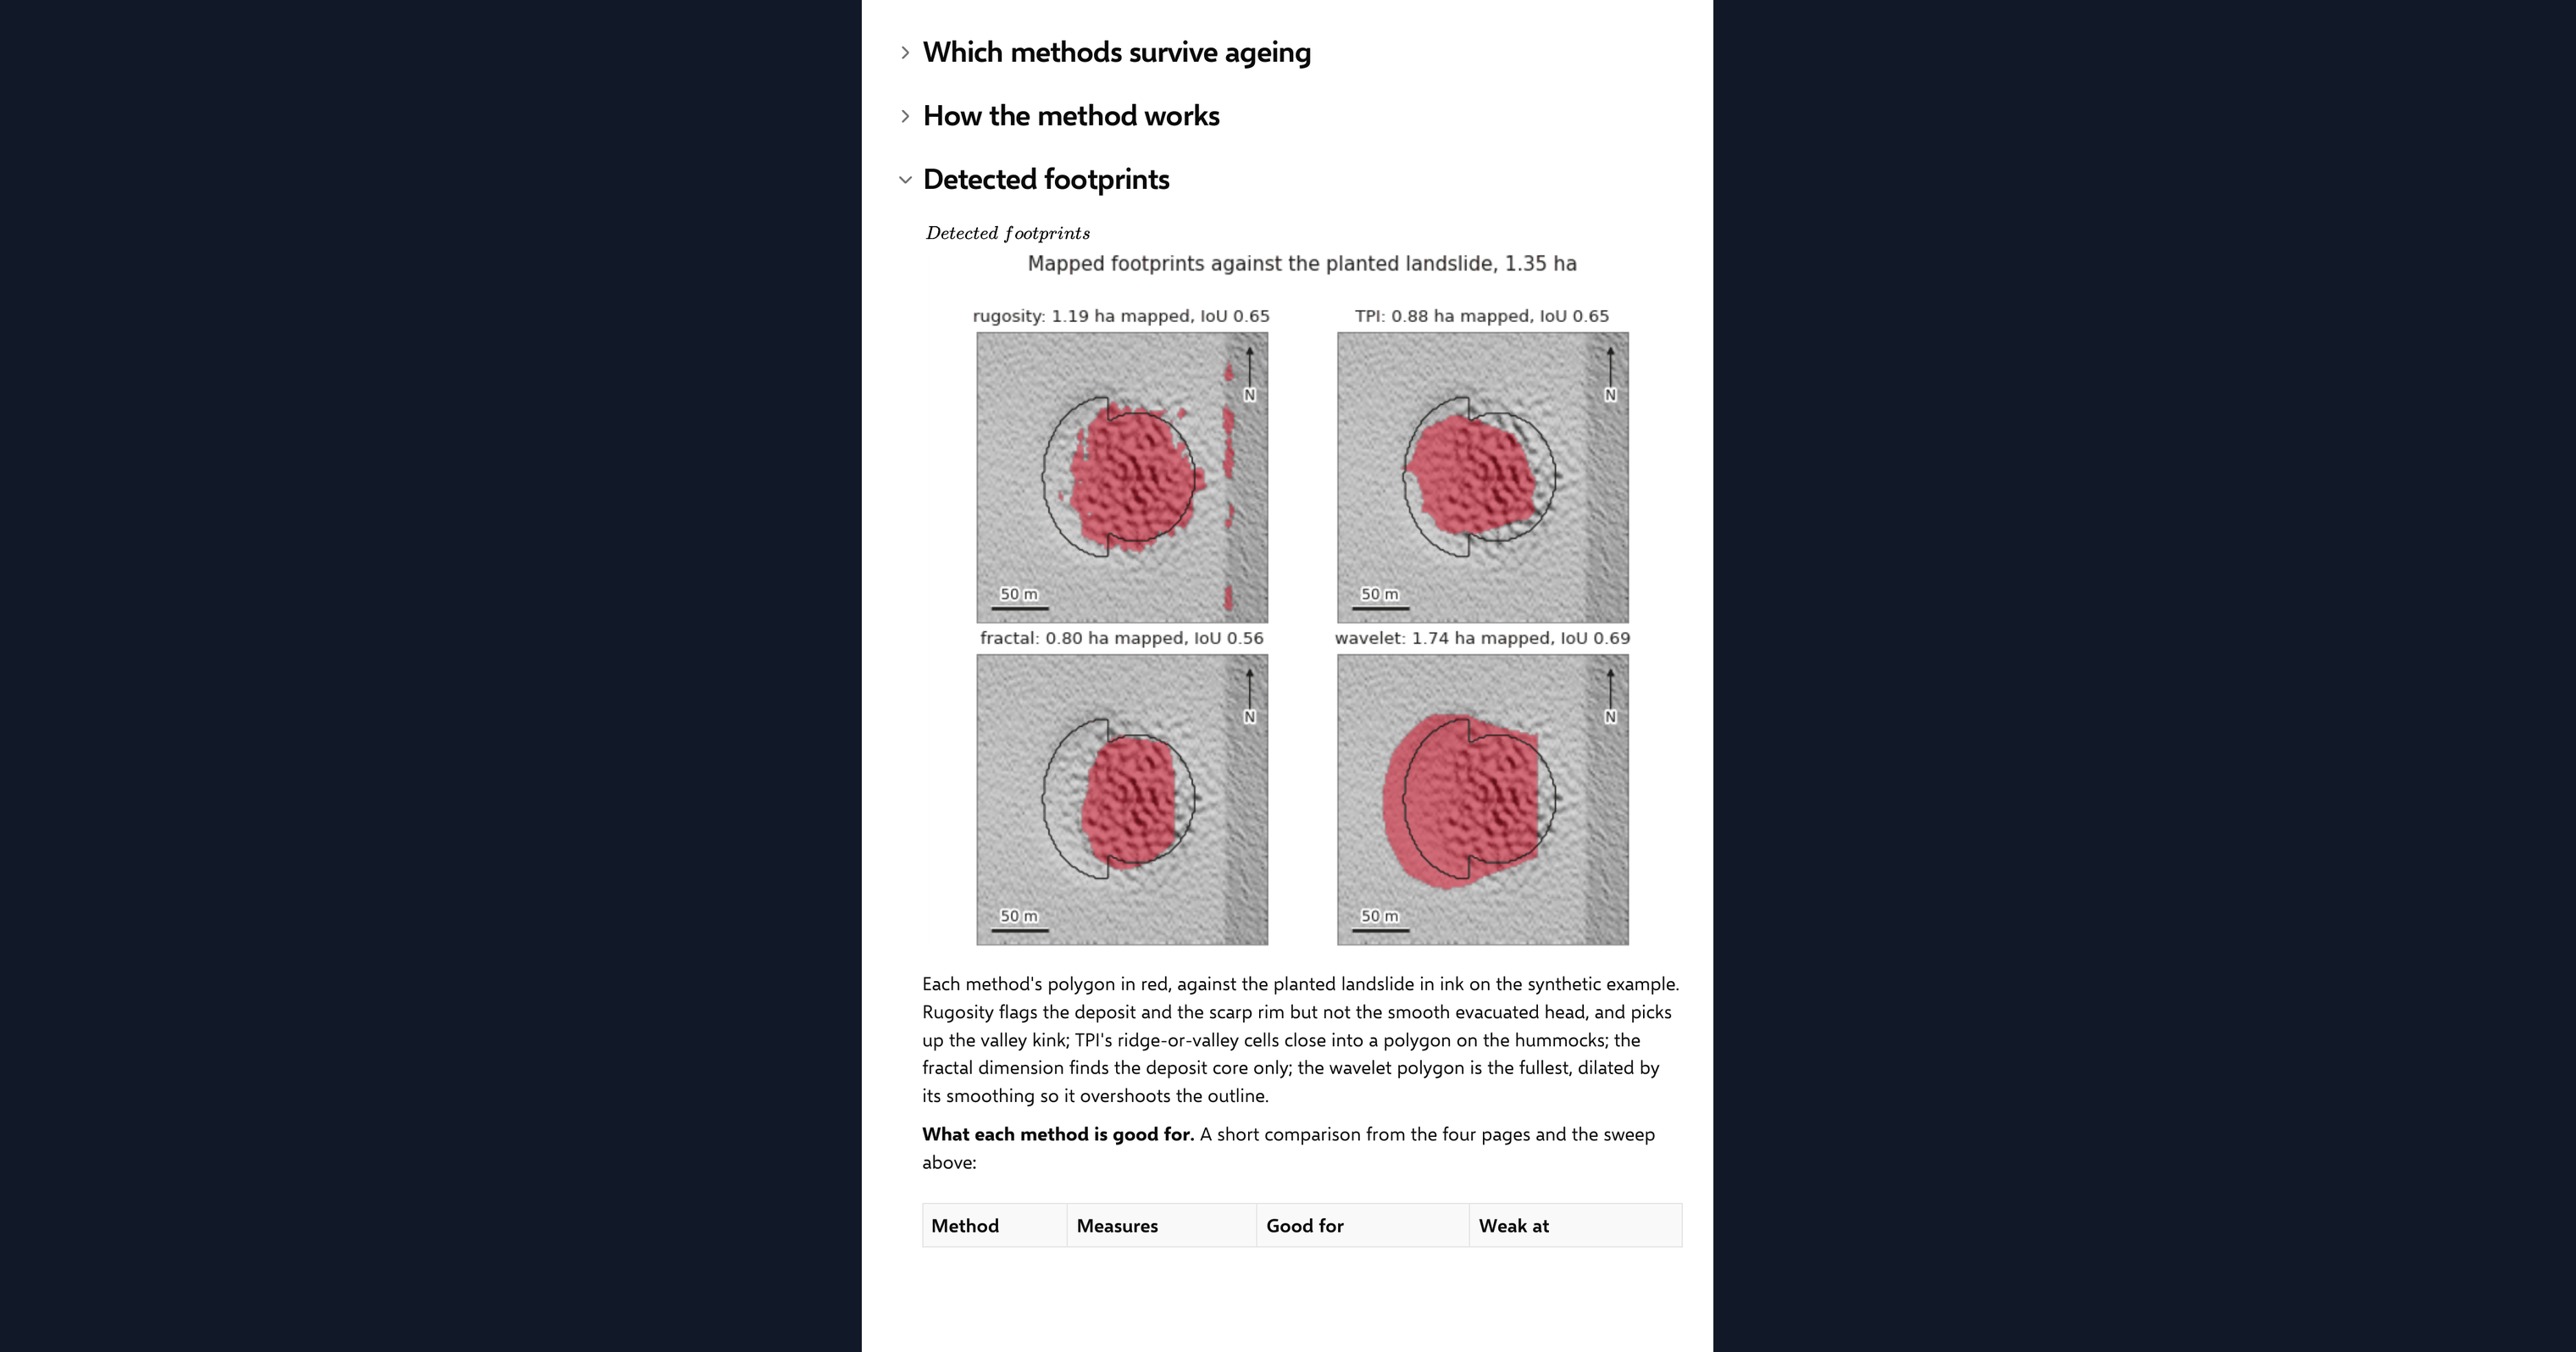
This page runs four terrain roughness methods in Python over one elevation grid, inside a CalcTree calculation page, and shows them side by side: the arc-chord rugosity index, the topographic position index, the variogram fractal dimension and the wavelet curvature power. Each map is turned into a polygon by its own rule, and the four polygons are drawn together over the hillshade. On the synthetic hillslope with a planted landslide, each polygon is compared with the known outline, and the landscape is aged by diffusion to show which signatures fade first. It also runs on your own elevation grid uploaded as a CSV.
- Engineering geologist or geotechnical engineer: choose a roughness method for a landslide inventory by seeing what each one maps on the same ground and how long each signal survives.
- Engineer exploring Python in calculations: read four published terrain methods implemented in NumPy and SciPy, each with its own closed-form check, on one page.
- Graduate engineer learning terrain analysis: change the deposit age and the method inputs and watch which polygons hold and which disappear.
It is an analysis aid, not a landslide assessment. It is an example of what a CalcTree page can do, built with CalcTree AI, not a design method to rely on as is. The model is idealised and its limits are stated on the page. Duplicate it into your own workspace to change the inputs, read the Python, or use it as the starting point for your own analysis, and verify anything you take into a real design.
More info on the Four Methods
Inputs
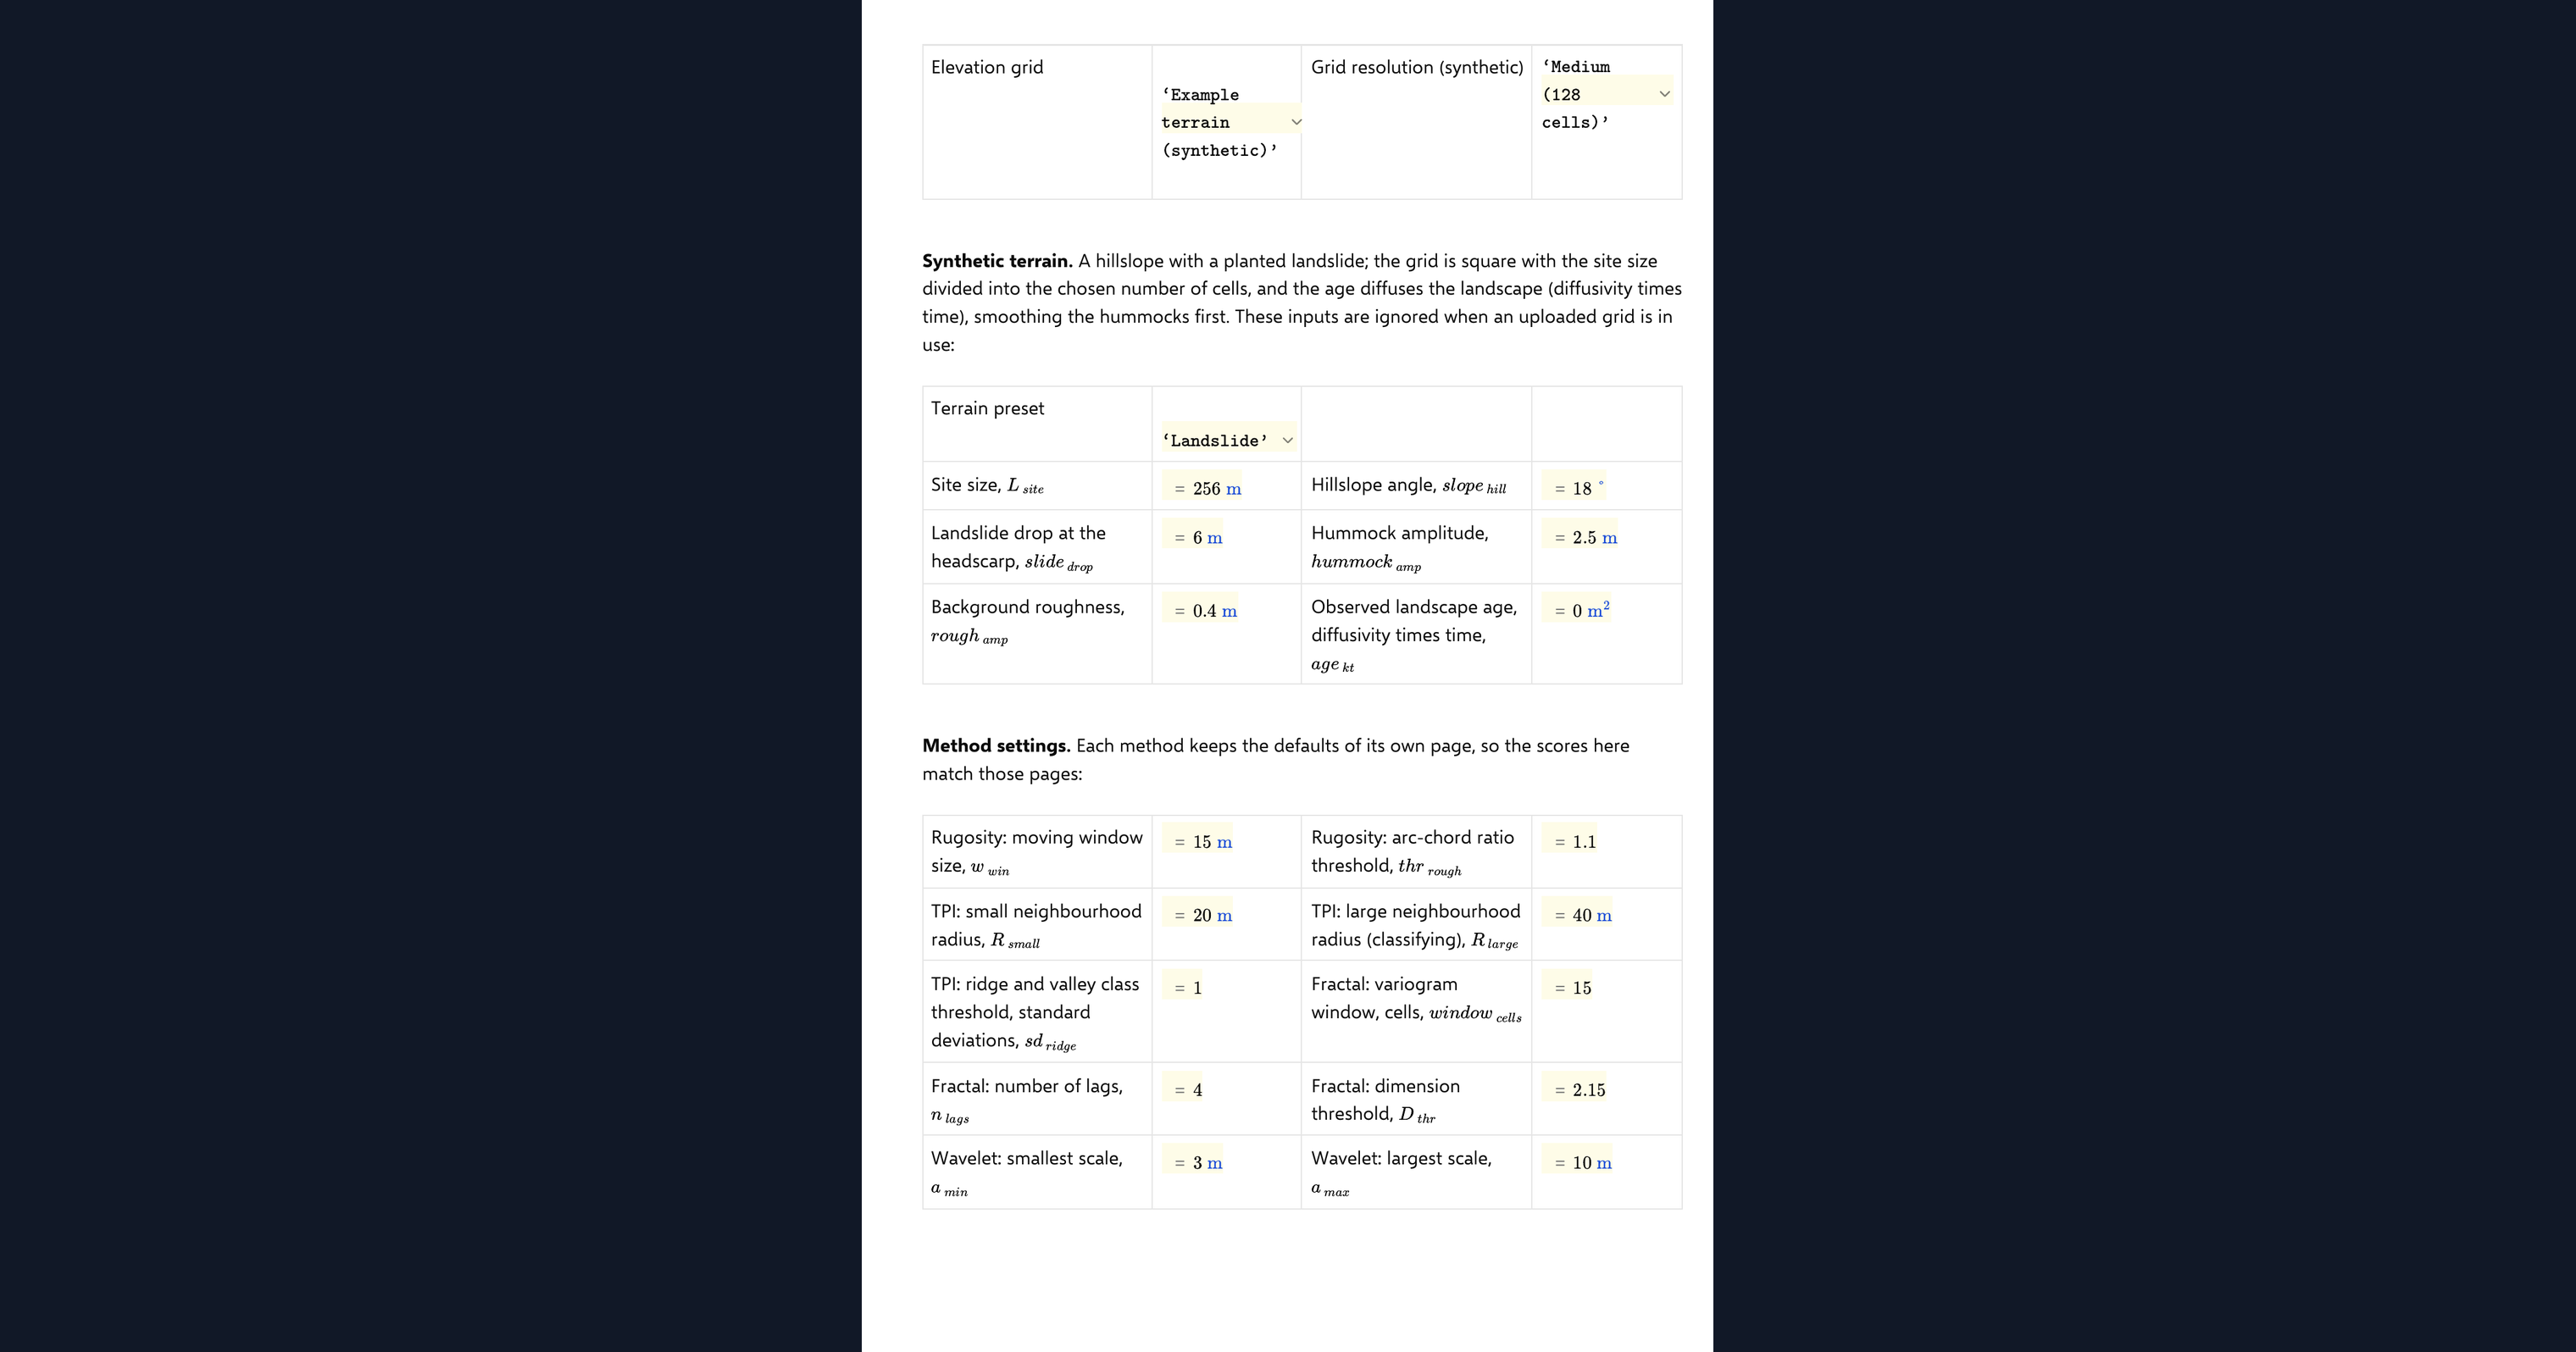
A data source dropdown chooses the example terrain or your uploaded grid. For the example you set a terrain preset, grid resolution and site size, the planted landslide and its diffusion age. Each method keeps the inputs of its own page: the window and threshold for rugosity, the two radii and class threshold for the position index, the window, lags and dimension threshold for the fractal method, and the scale band, smoothing and threshold factor for the wavelet. A shared channel buffer, the overlap level the surviving age is read at, and the oldest age of the sweep complete the set. Your own elevation grid goes in as a CSV with x_m, y_m and z_m columns on a regular grid, loaded as a page dataset. The page refuses a grid that is not regular or is missing cells and says why, and it thins a grid wider than 192 cells a side to the smallest whole step that fits.
The four detectors
Rugosity follows the surface-area approach of Jenness (2004) with the slope correction of Du Preez (2015). The position index follows Weiss (2001), with cells classed ridge or valley at the large radius counting as rough. The fractal dimension follows Mark and Aronson (1984) and Klinkenberg (1994). The wavelet power follows Booth, Roering and Perron (2009). Each is thresholded, masked at the channel and cleaned into a polygon by closing, hole filling and erosion.
Ageing the landscape
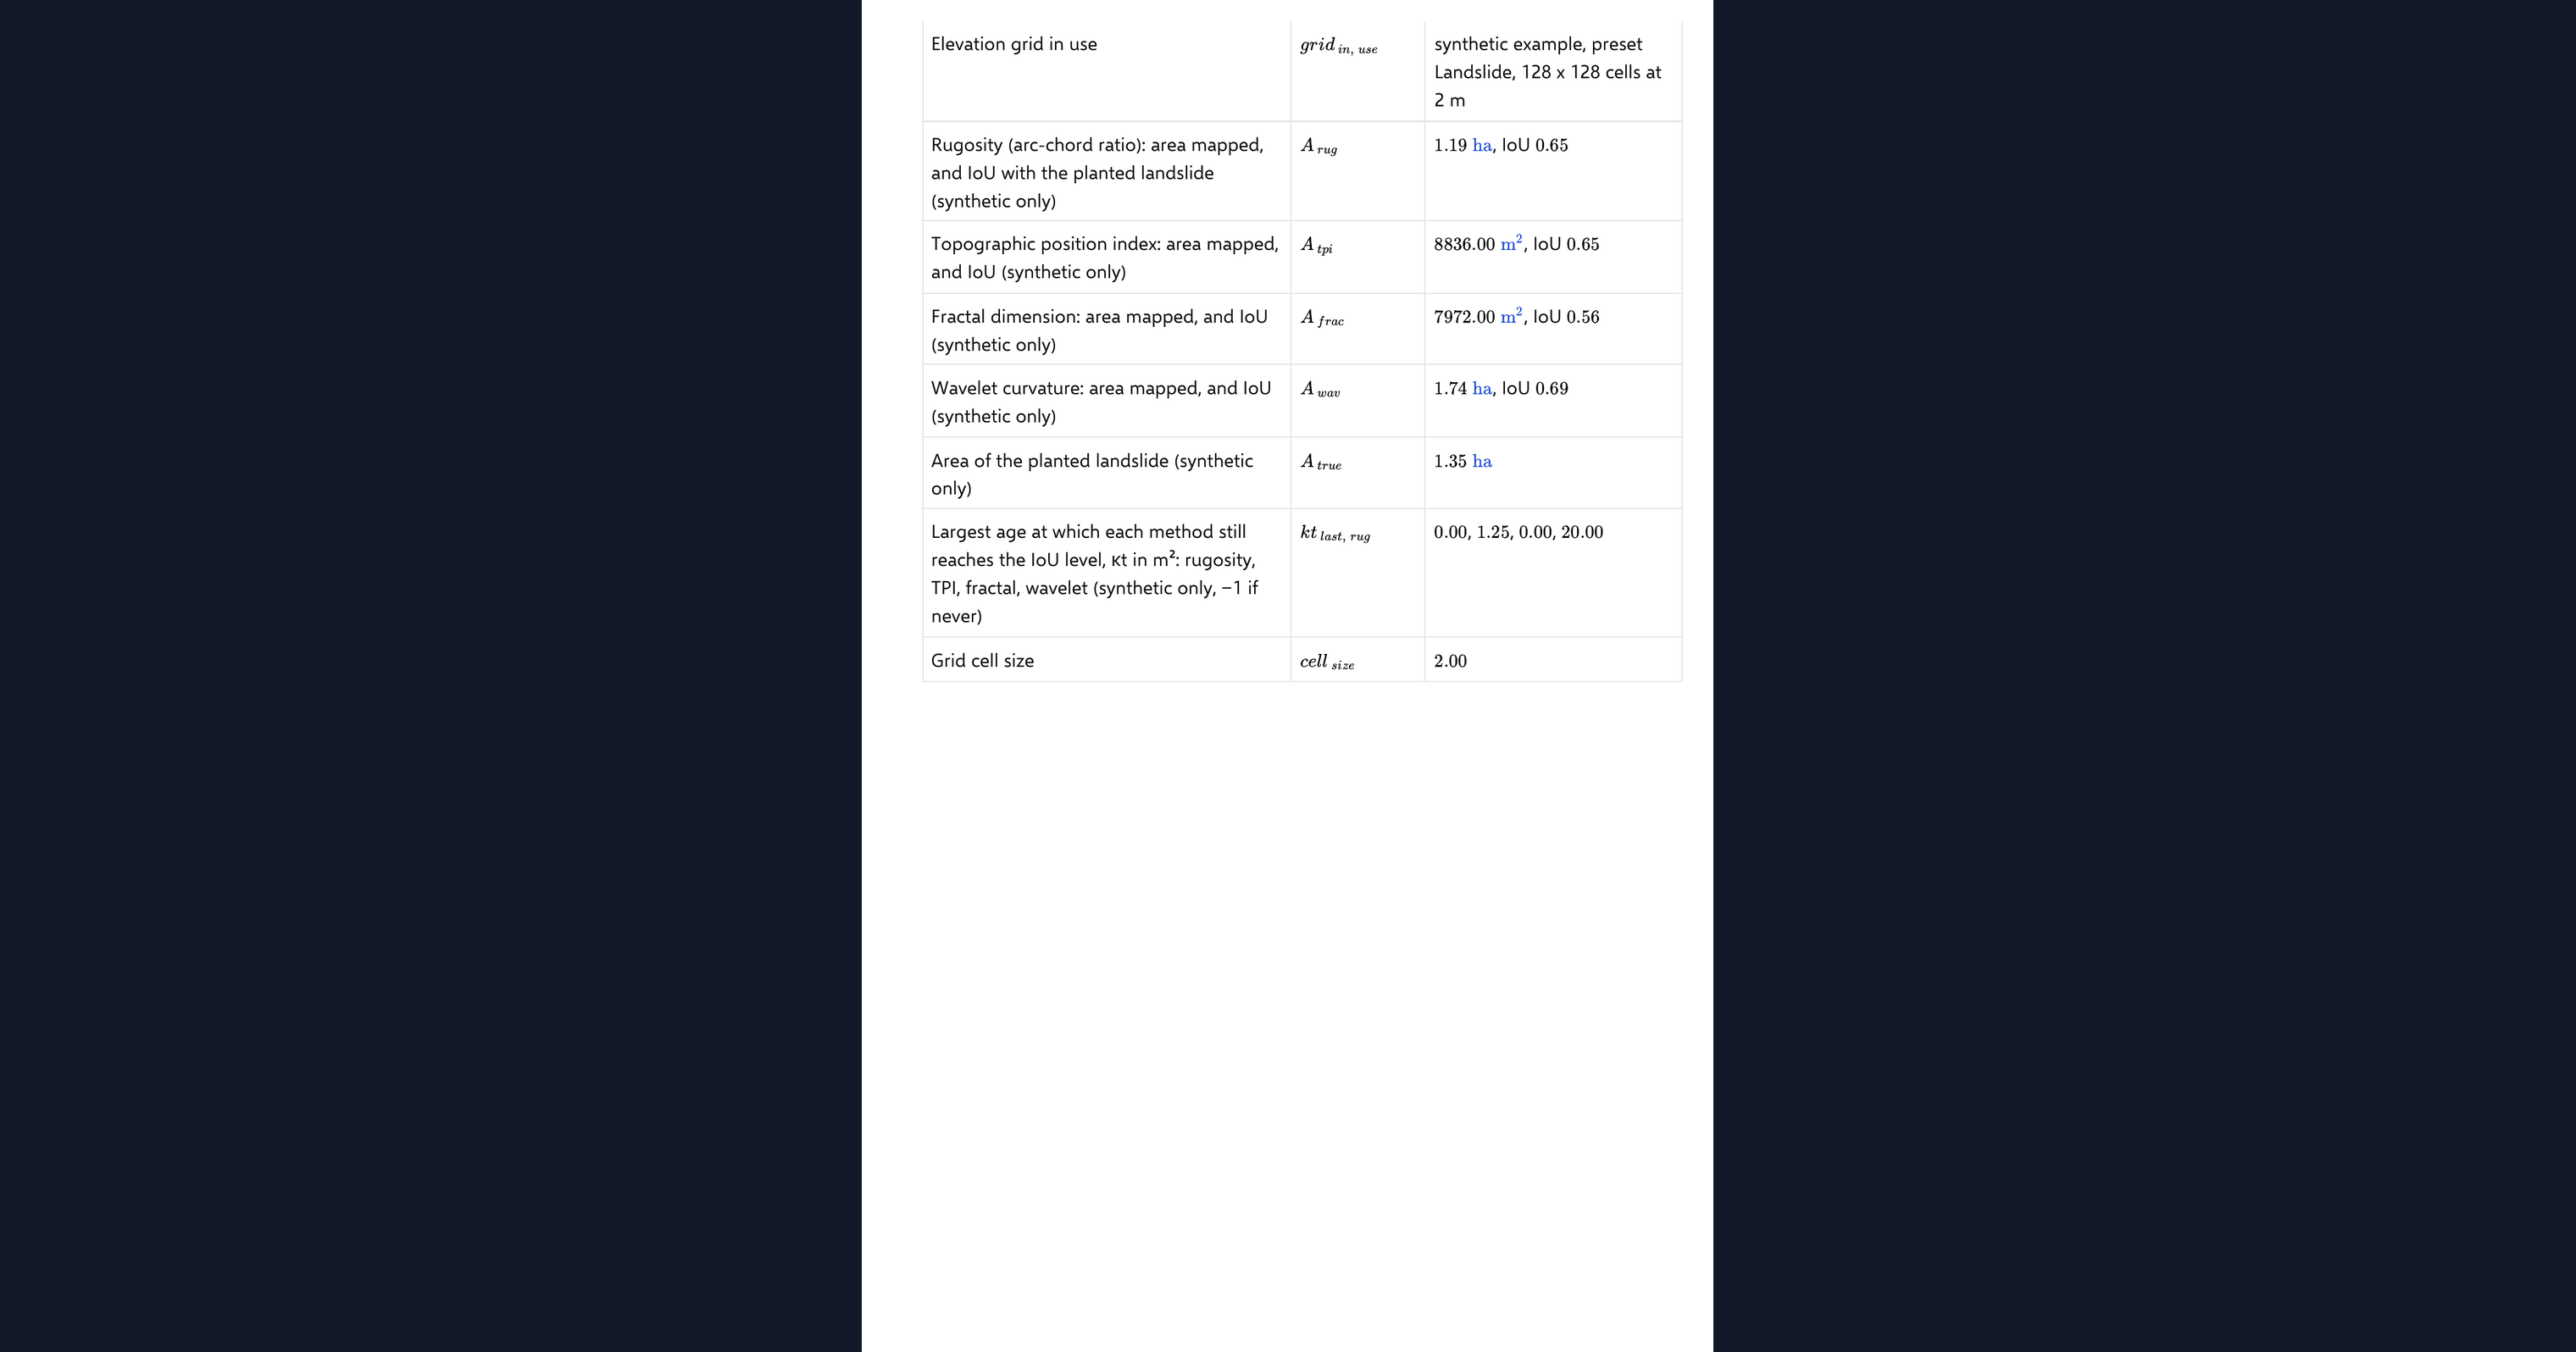
The example landslide is diffused forward over a sweep of ages from fresh to the maximum you set, and each detector is run at every step. The page reports the oldest age at which each polygon still overlaps the planted outline by the level you chose. Cell-scale texture methods fade within a few square metres of diffusion; the wavelet, which reads curvature at the hummock scale, survives far longer. On an uploaded grid the sweep diffuses your ground forward and reports the mapped area per method instead.
Checking the analysis
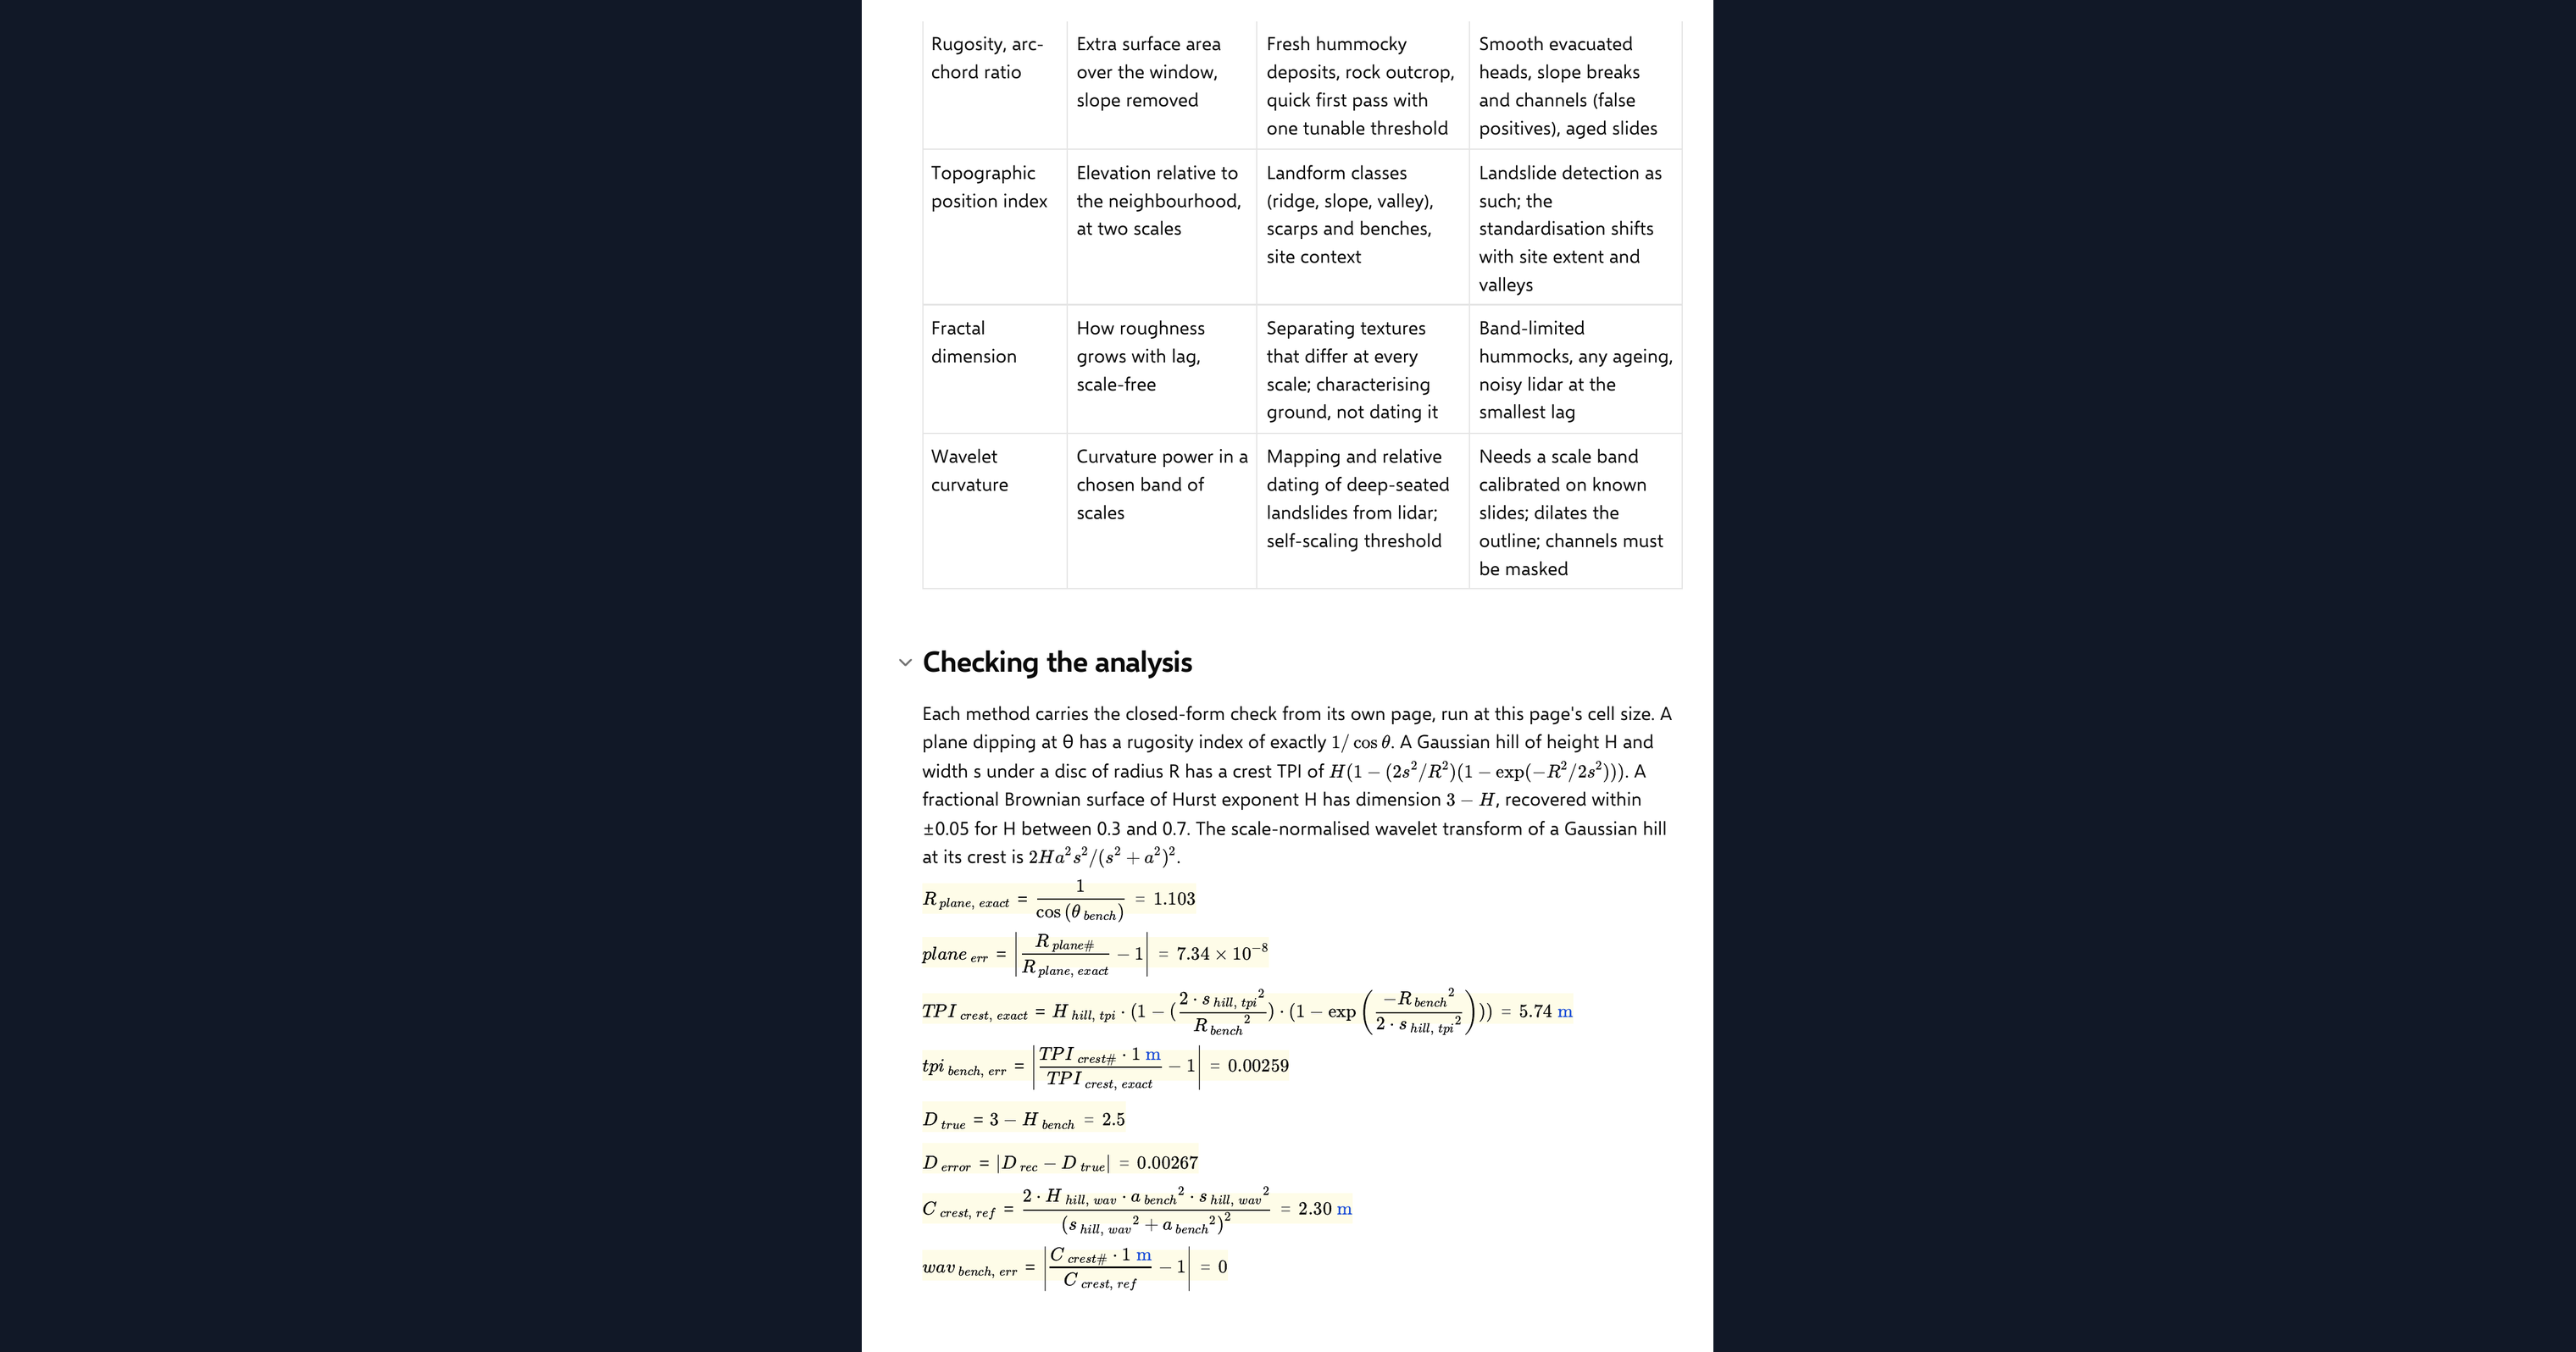
Each method carries the closed-form check of its own page: a plane and a sinusoid for rugosity, a Gaussian hill crest for the position index, a synthetic fractal surface for the dimension, and a Gaussian hill coefficient for the wavelet. One agreement chip reports all four.
Python libraries used
NumPy holds the grid and runs the lagged differences and Fourier transforms. SciPy filters, convolves, fits and cleans the polygons. Matplotlib draws the four maps, the footprints, the survival chart and the design sketch.
Common Calculation Errors to Avoid
- Comparing methods at different settings: a method tuned on one site and another left at its defaults do not compare. The page keeps each at its own published defaults on the same grid.
- Judging a method on a fresh deposit only: on fresh ground every method maps something. The differences appear with age, which is why the sweep is there.
- Standardising the position index over the wrong area: a site-wide standardisation is dominated by the valley, so the landslide sits under one standard deviation and the method ages like a texture method. Know what the thresholds are relative to.
- Mixing grid sizes: the four source methods used different grid presets. On this page the medium and fine grids match them exactly and the coarse one does not.
- Reading overlap as accuracy: overlap with a planted outline measures where a method finds roughness, not whether it found a landslide. The rough ground is the deposit and the rim, never the whole slide.
- Dividing by zero on slide-free ground: on a preset with no landslide the overlap and area ratio must read zero, not a ratio of nothing to nothing. Define the result for the empty case.
Engineering templates
Common calculators
Design guides




FAQs
Which roughness method is best for mapping landslides?
On the example terrain the wavelet curvature power maps the deposit most completely and survives the longest ageing, because it reads curvature at the hummock scale rather than cell-scale texture. The other three are simpler and still useful on fresh ground, and the page lets you see the trade-off on your own grid.
Why do the rugosity and fractal polygons vanish after a little ageing?
Both measure texture at the cell scale, and a few square metres of diffusion erases it. The hummocks are still there at their own wavelength, which is why the wavelet still sees them.
Are the method inputs the same as on the individual pages?
Yes. Each method keeps its own page's defaults, and the medium and fine grids match those pages exactly. The results at the default age are the same numbers you will find on each method's own page.
Can I run the comparison on my own elevation data?
Yes. Upload a regular x_m, y_m, z_m grid as the page dataset and switch the data source. All four maps and polygons then come from your ground, and the ageing sweep reports mapped area per method rather than overlap with a planted outline.
How is each method checked?
With the closed-form benchmark from its own page, run on this page and reported in one agreement chip: the plane and sinusoid for rugosity, the Gaussian hill crest for the position index, a synthetic fractal surface for the dimension, and the Gaussian hill coefficient for the wavelet.
Learn about the benefits of using CalcTree on engineering projects!