
Surface roughness from a DEM in Python: rugosity index and arc-chord ratio mapped over a hillshade, on example terrain or your own grid. Open a copy free.

Tell us what you need, or sign up and build it yourself in minutes.
Leave your email and we'll tell you when a template for it is ready:








No items found.
No items found.
About this Surface Roughness Example
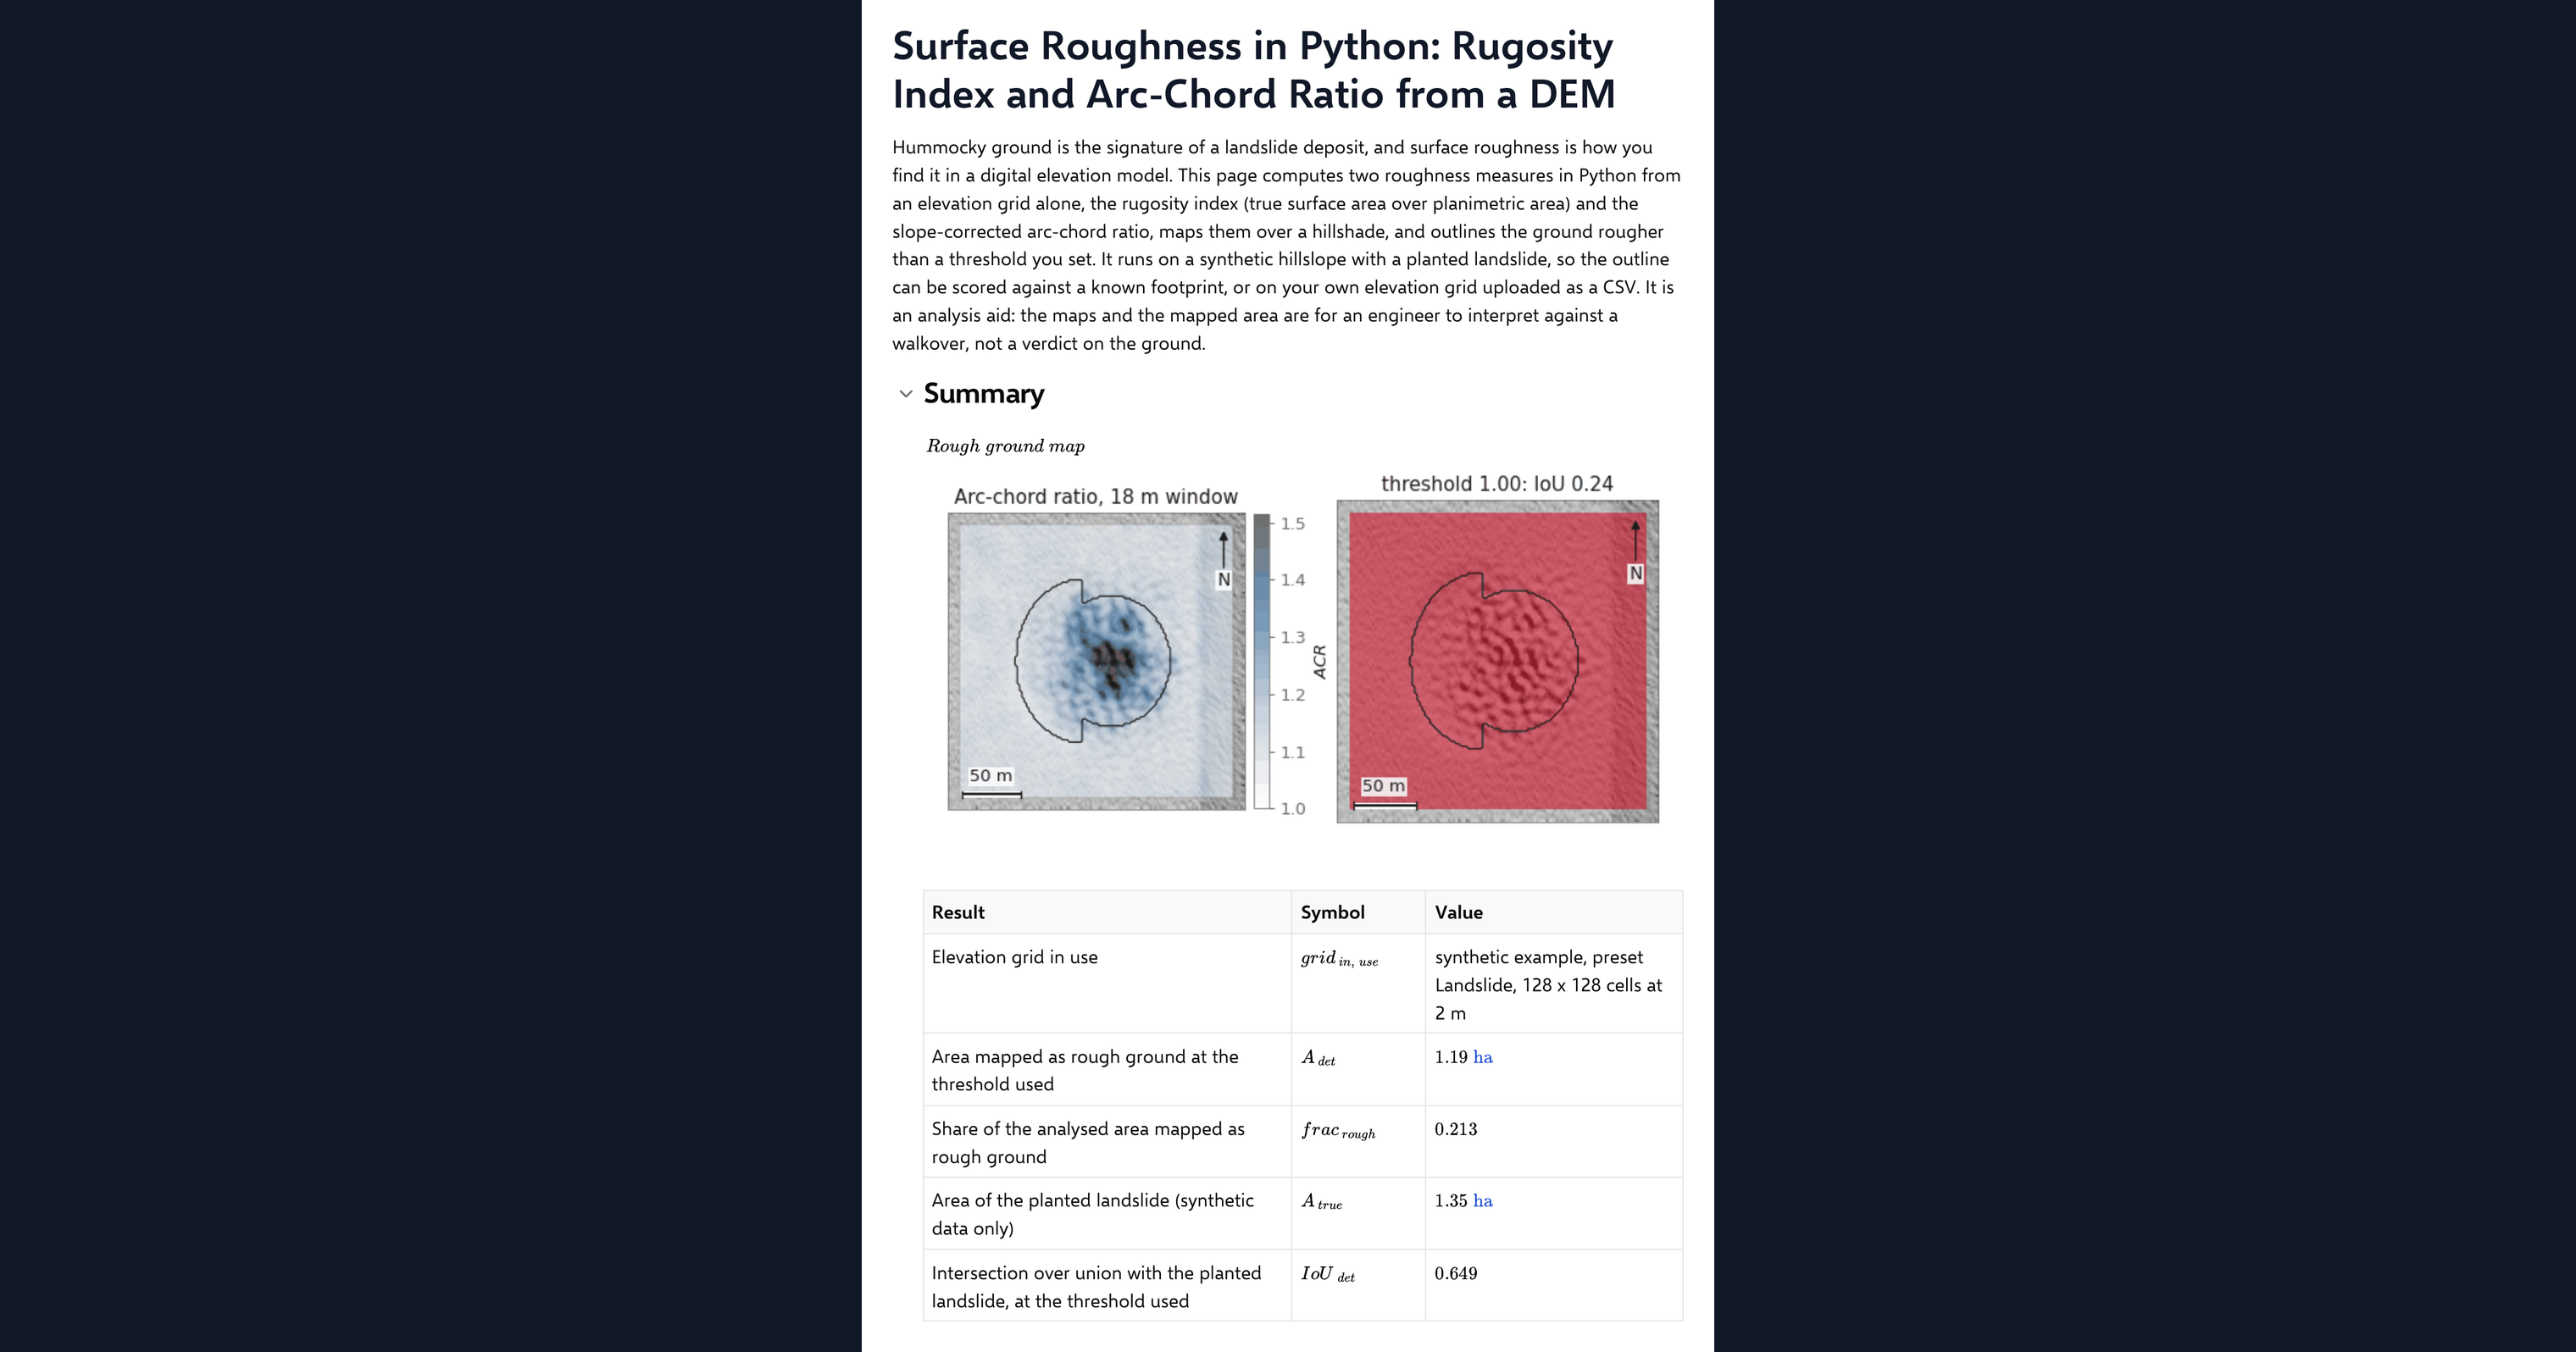
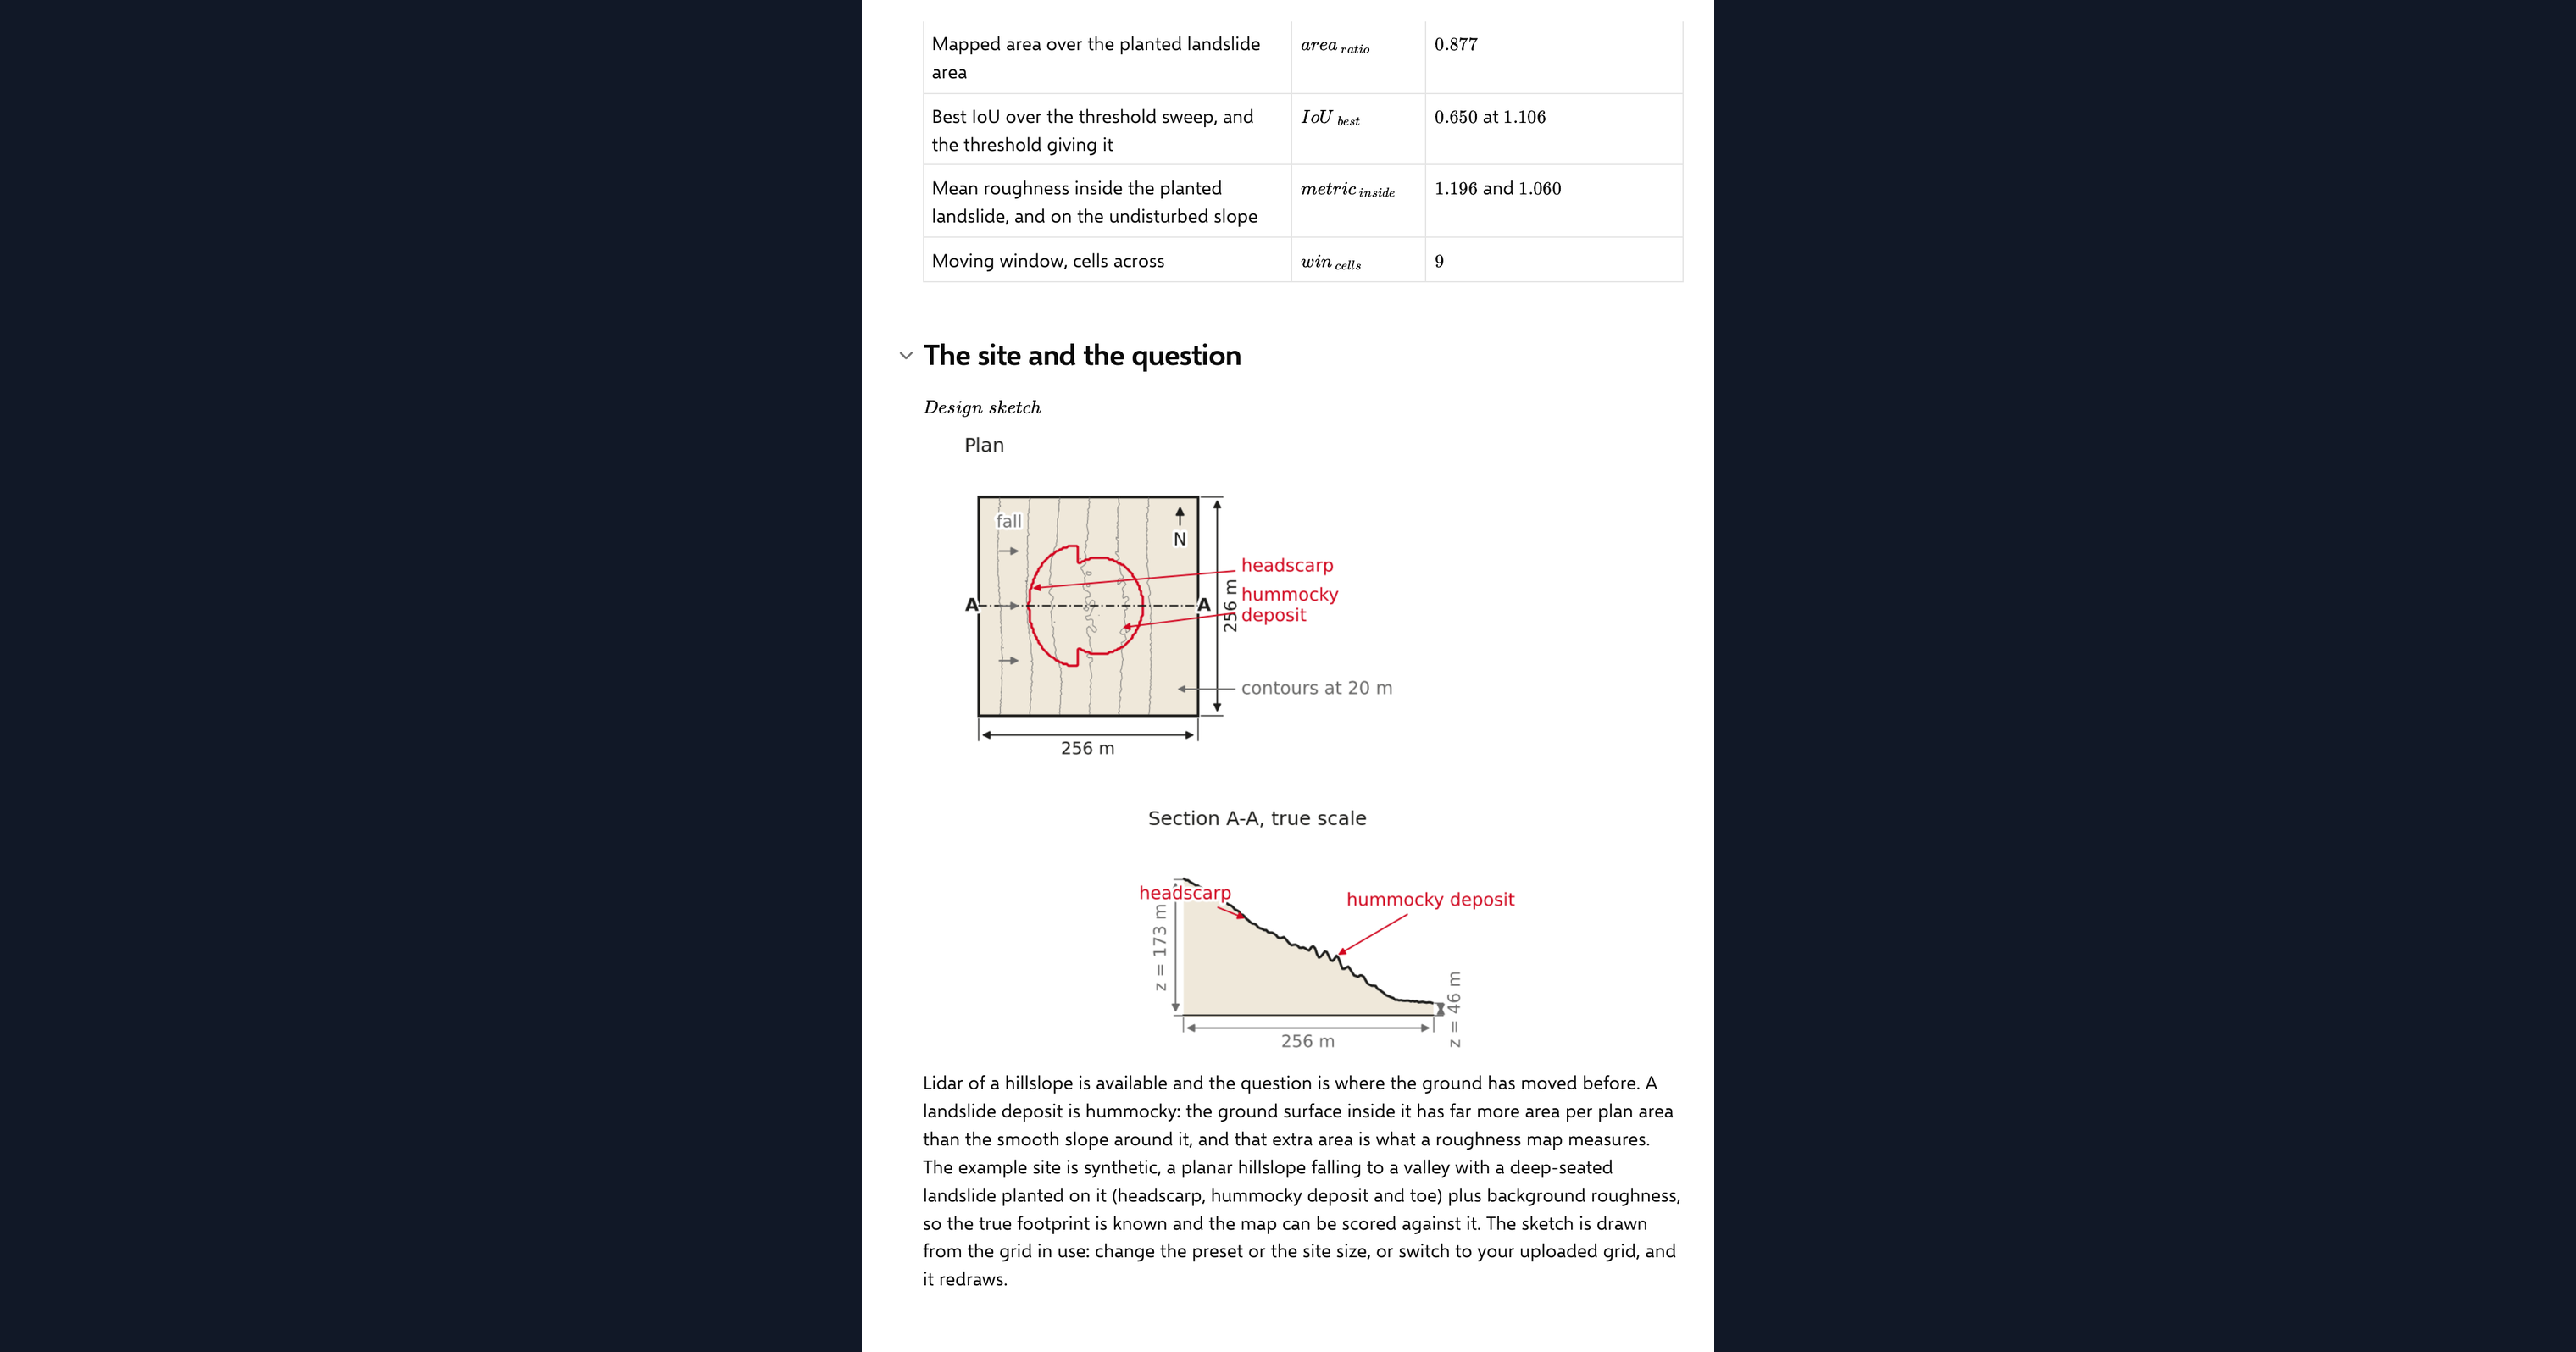
This page computes surface roughness from a DEM in Python, inside a CalcTree calculation page. Hummocky ground is the signature of a landslide deposit, and roughness is how you find it in an elevation grid. The page works out two measures from the grid alone, the rugosity index (true surface area over planimetric area) and the slope-corrected arc-chord ratio, maps both over a hillshade, and outlines the ground rougher than a threshold you set. It runs on a synthetic hillslope with a planted landslide, so the outline can be compared with a known footprint, or on your own elevation grid uploaded as a CSV.
- Engineering geologist or geotechnical engineer: map the hummocky ground on a slope from survey or lidar data before walking it, and see how much of a planted deposit a roughness threshold picks up.
- Engineer exploring Python in calculations: read a complete terrain analysis, from the per-cell surface area to the mapped polygon, in a few hundred lines of NumPy and SciPy on one page.
- Graduate engineer learning terrain analysis: change the window size, the threshold and the deposit age and watch the maps and the mapped area respond.
It is an analysis aid, not a landslide assessment. It is an example of what a CalcTree page can do, built with CalcTree AI, not a design method to rely on as is. The model is idealised and its limits are stated on the page. Duplicate it into your own workspace to change the inputs, read the Python, or use it as the starting point for your own analysis, and verify anything you take into a real design.
More info on Terrain Rugosity
Inputs
A data source dropdown chooses the example terrain or your uploaded grid. For the example you pick a terrain preset and grid resolution, the hillslope angle, the size and amplitude of the planted landslide and its diffusion age, which smooths the hummocks as a real deposit weathers. The method inputs are the window size the roughness is averaged over and the arc-chord ratio threshold that defines rough ground. Your own elevation grid goes in as a CSV with x_m, y_m and z_m columns on a regular grid, loaded as a page dataset. The page refuses a grid that is not regular or is missing cells and says why, and it thins a grid wider than 192 cells a side to the smallest whole step that fits.
The rugosity index
Each cell's true surface area comes from eight triangles joining the cell centre to the midpoints toward its eight neighbours, following the surface-area approach of Jenness (2004). Dividing by the planimetric area gives the cell rugosity, which is then averaged over the moving window. On its own this measure rises with slope, so a smooth steep hillside reads as rough.
The arc-chord ratio
The arc-chord ratio corrects for that. The page fits a least-squares plane through each window, and multiplies the window rugosity by the cosine of that plane's dip, following Du Preez (2015). A smooth plane at any angle then reads exactly one, and only the texture on top of the slope counts. Cells above the threshold form the mapped rough ground.
Checking the analysis
Two closed forms check the code. An inclined plane must give a rugosity of one over the cosine of its slope and an arc-chord ratio of exactly one, and a sinusoidal surface must match the arc-length integral evaluated by numerical quadrature. One agreement chip reports both. On the example terrain the mapped area is also compared with the planted footprint, as a result rather than a verdict: roughness finds the hummocky deposit and the scarp, not the smooth evacuated head.
Python libraries used
NumPy holds the grid and computes the triangle areas with the three-dimensional cross product. SciPy averages the roughness over the window, fits the window planes and integrates the sinusoid benchmark. Matplotlib draws the hillshade, the roughness maps, the mapped outline, the threshold curve and the design sketch.
Common Calculation Errors to Avoid
- Reading slope as roughness: the raw rugosity index rises on any steep smooth slope. Use the arc-chord ratio, or another slope-corrected measure, when the ground is not flat.
- A window smaller than the texture: hummocks a few metres across need a window wider than their spacing, or the measure sees the hummocks as slope and misses them.
- Expecting an old deposit to show: diffusion erases cell-scale roughness within a few square metres of diffusion age. A smooth old landslide is invisible to a roughness measure, which is a limit of the method, not a sign of stable ground.
- Trusting a mapped polygon as a boundary: the rough ground is the deposit and the scarp rim, not the whole landslide. The evacuated head is smooth and is not mapped.
- A grid that is too coarse: cell-scale texture needs cells smaller than the hummocks. Thinning a fine grid to fit the page changes what the method can see.
- Counting slope breaks as deposits: a valley floor kink or a road batter can cross the threshold on its own. Check the map against the hillshade before taking a polygon further.
Engineering templates
Common calculators
Design guides




FAQs
What is the difference between the rugosity index and the arc-chord ratio?
Rugosity is the true surface area over the planimetric area, so it grows with slope as well as texture. The arc-chord ratio multiplies it by the cosine of the local slope, so a smooth inclined plane reads one and only the roughness on top of the slope remains.
Can I run it on my own elevation data?
Yes. Export a regular grid with x_m, y_m and z_m columns, upload it as the page dataset and switch the data source dropdown. The maps and the mapped area then come from your ground; the comparison with the planted footprint reads n/a because there is no known truth.
How do I choose the threshold?
On the example terrain the page plots mapped area against threshold, so you can see where the rough deposit separates from the slope. On real ground start from the default and check the outline against the hillshade and anything you know about the site.
Why does the mapped outline miss the top of the landslide?
Because the evacuated head is smooth. Roughness picks up the hummocky deposit and the scarp line, so the mapped polygon covers the lower part of the slide and its rim, and the page reports the overlap with the full planted outline as a result rather than a pass or fail.
Does the diffusion age mean anything for a real deposit?
It is a way to age the example. Real hillslopes smooth by diffusion too, and the age input shows how quickly cell-scale roughness fades, but turning a measured roughness into years needs a calibrated diffusivity for the site.
Learn about the benefits of using CalcTree on engineering projects!