
Compare plain, lipped and hat cold-formed sections by elastic buckling with a live pyCUFSM finite strip analysis, plotted together and ranked per unit area.

This template is not available yet. You can sign up and create it yourself!
Or let us know if you'd like to be notified when it’s ready:
No items found.
No items found.
About this calculation
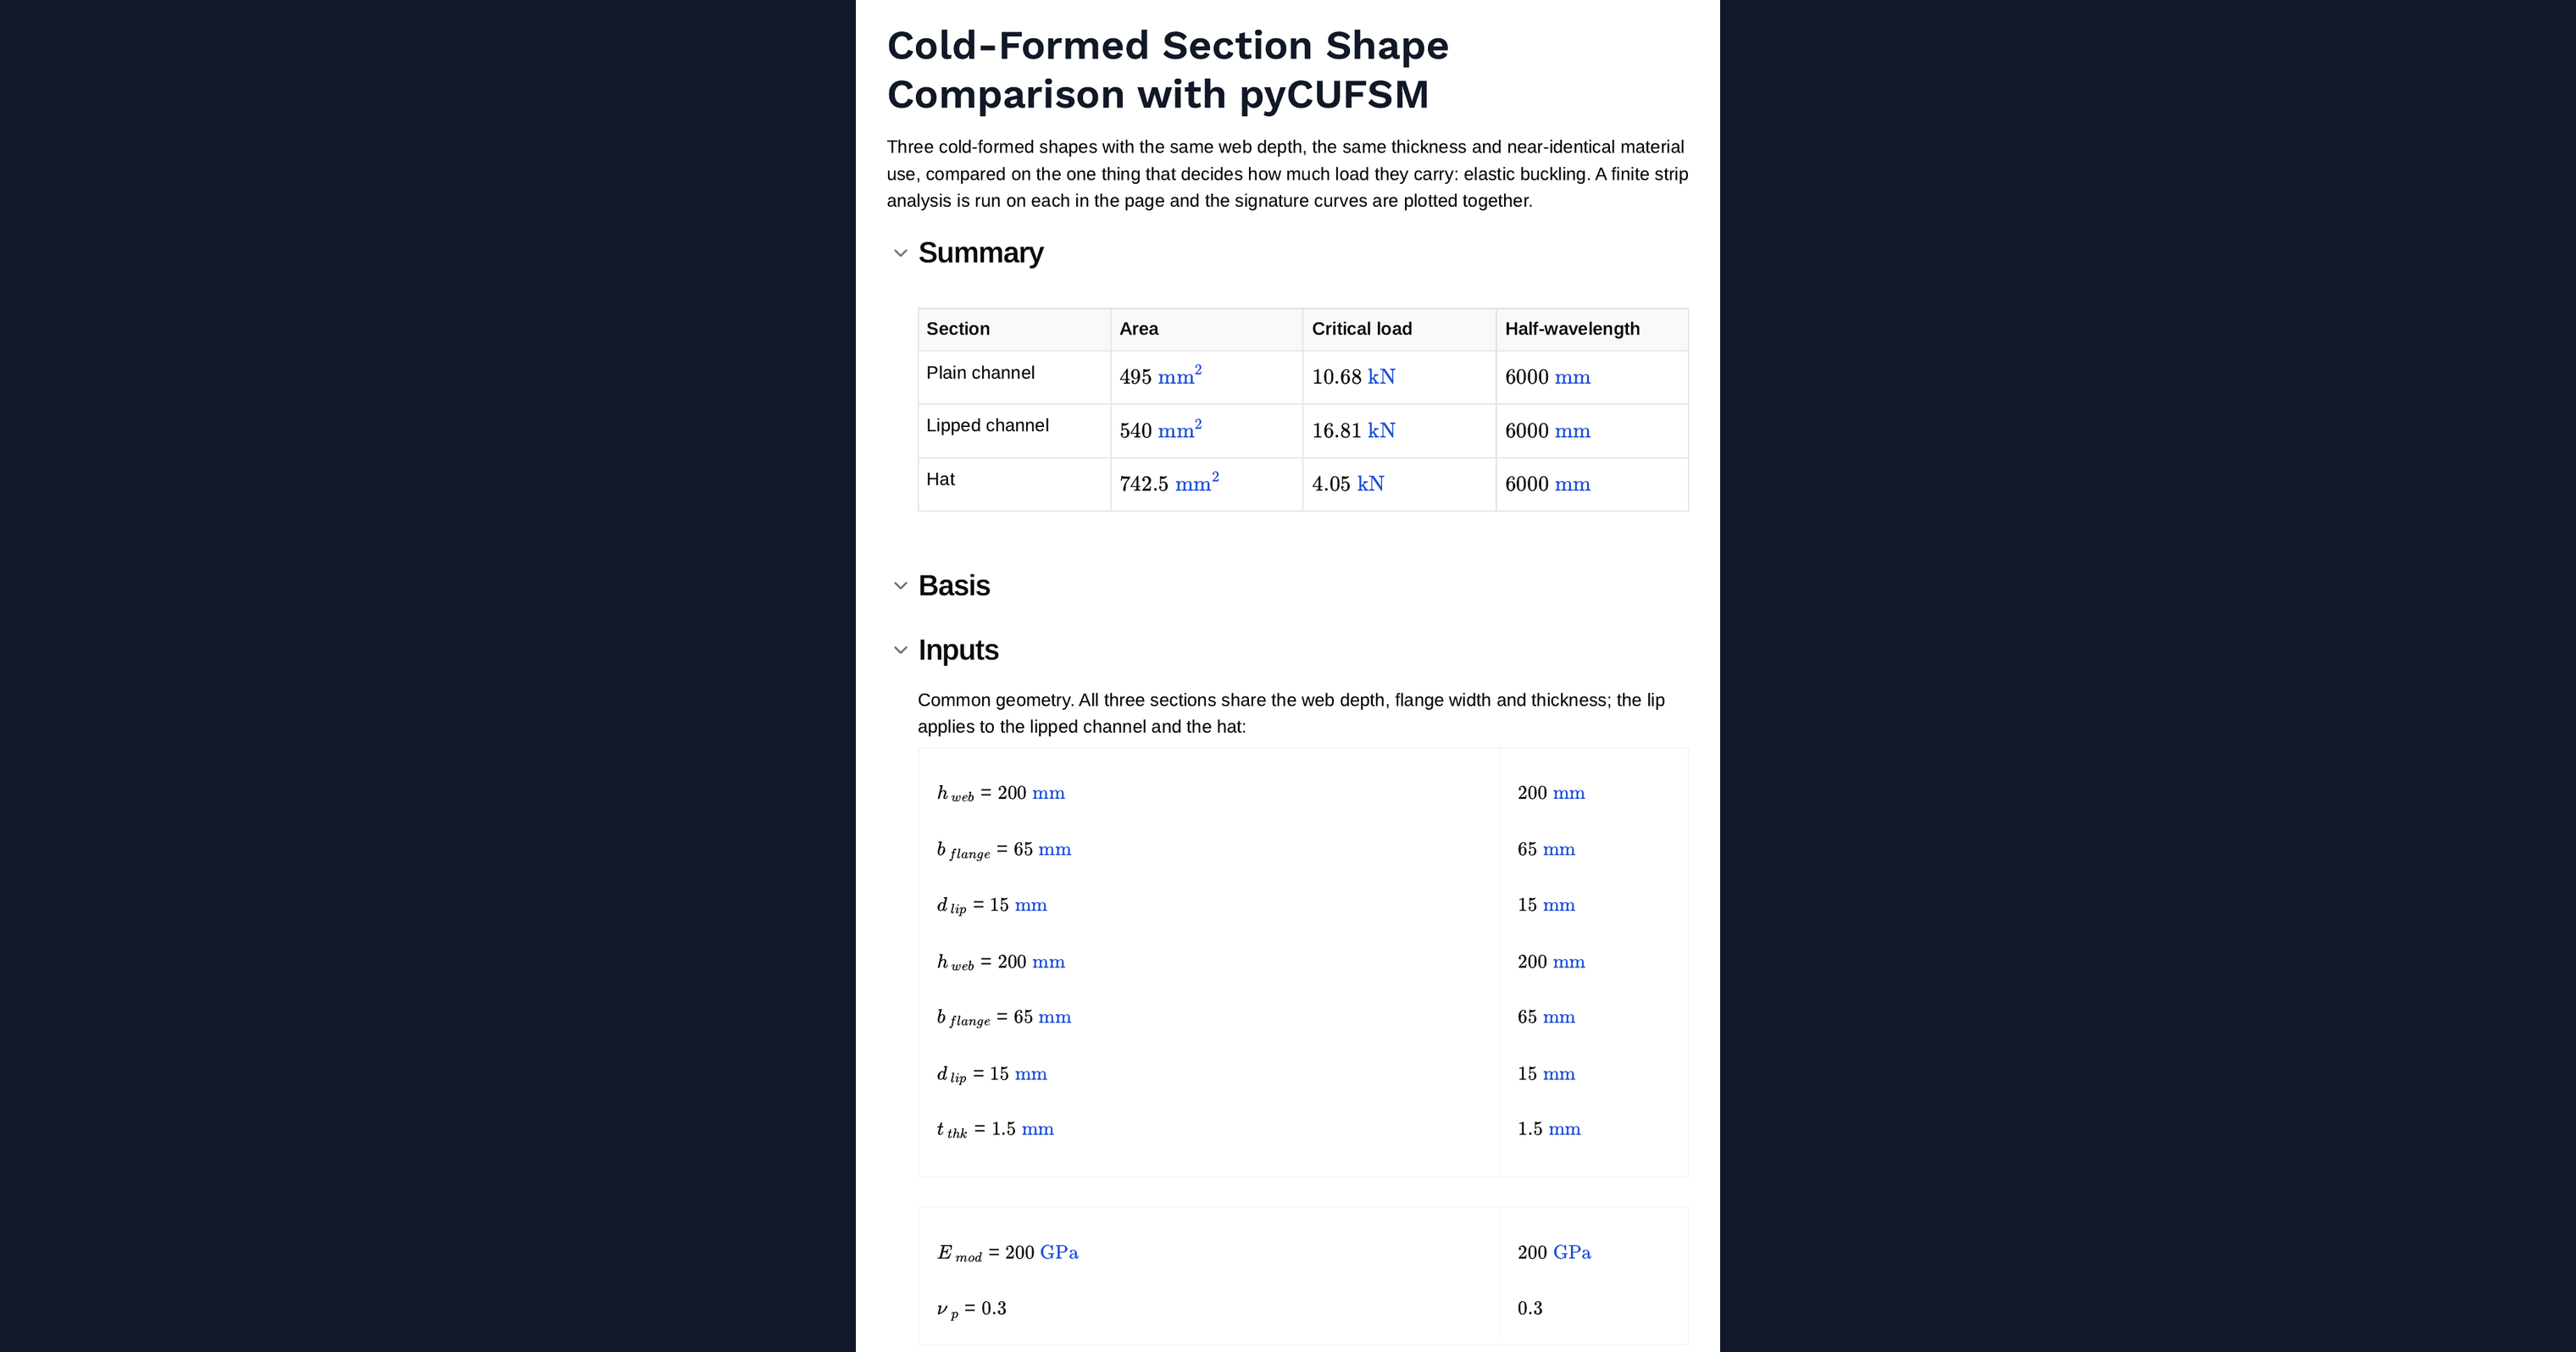
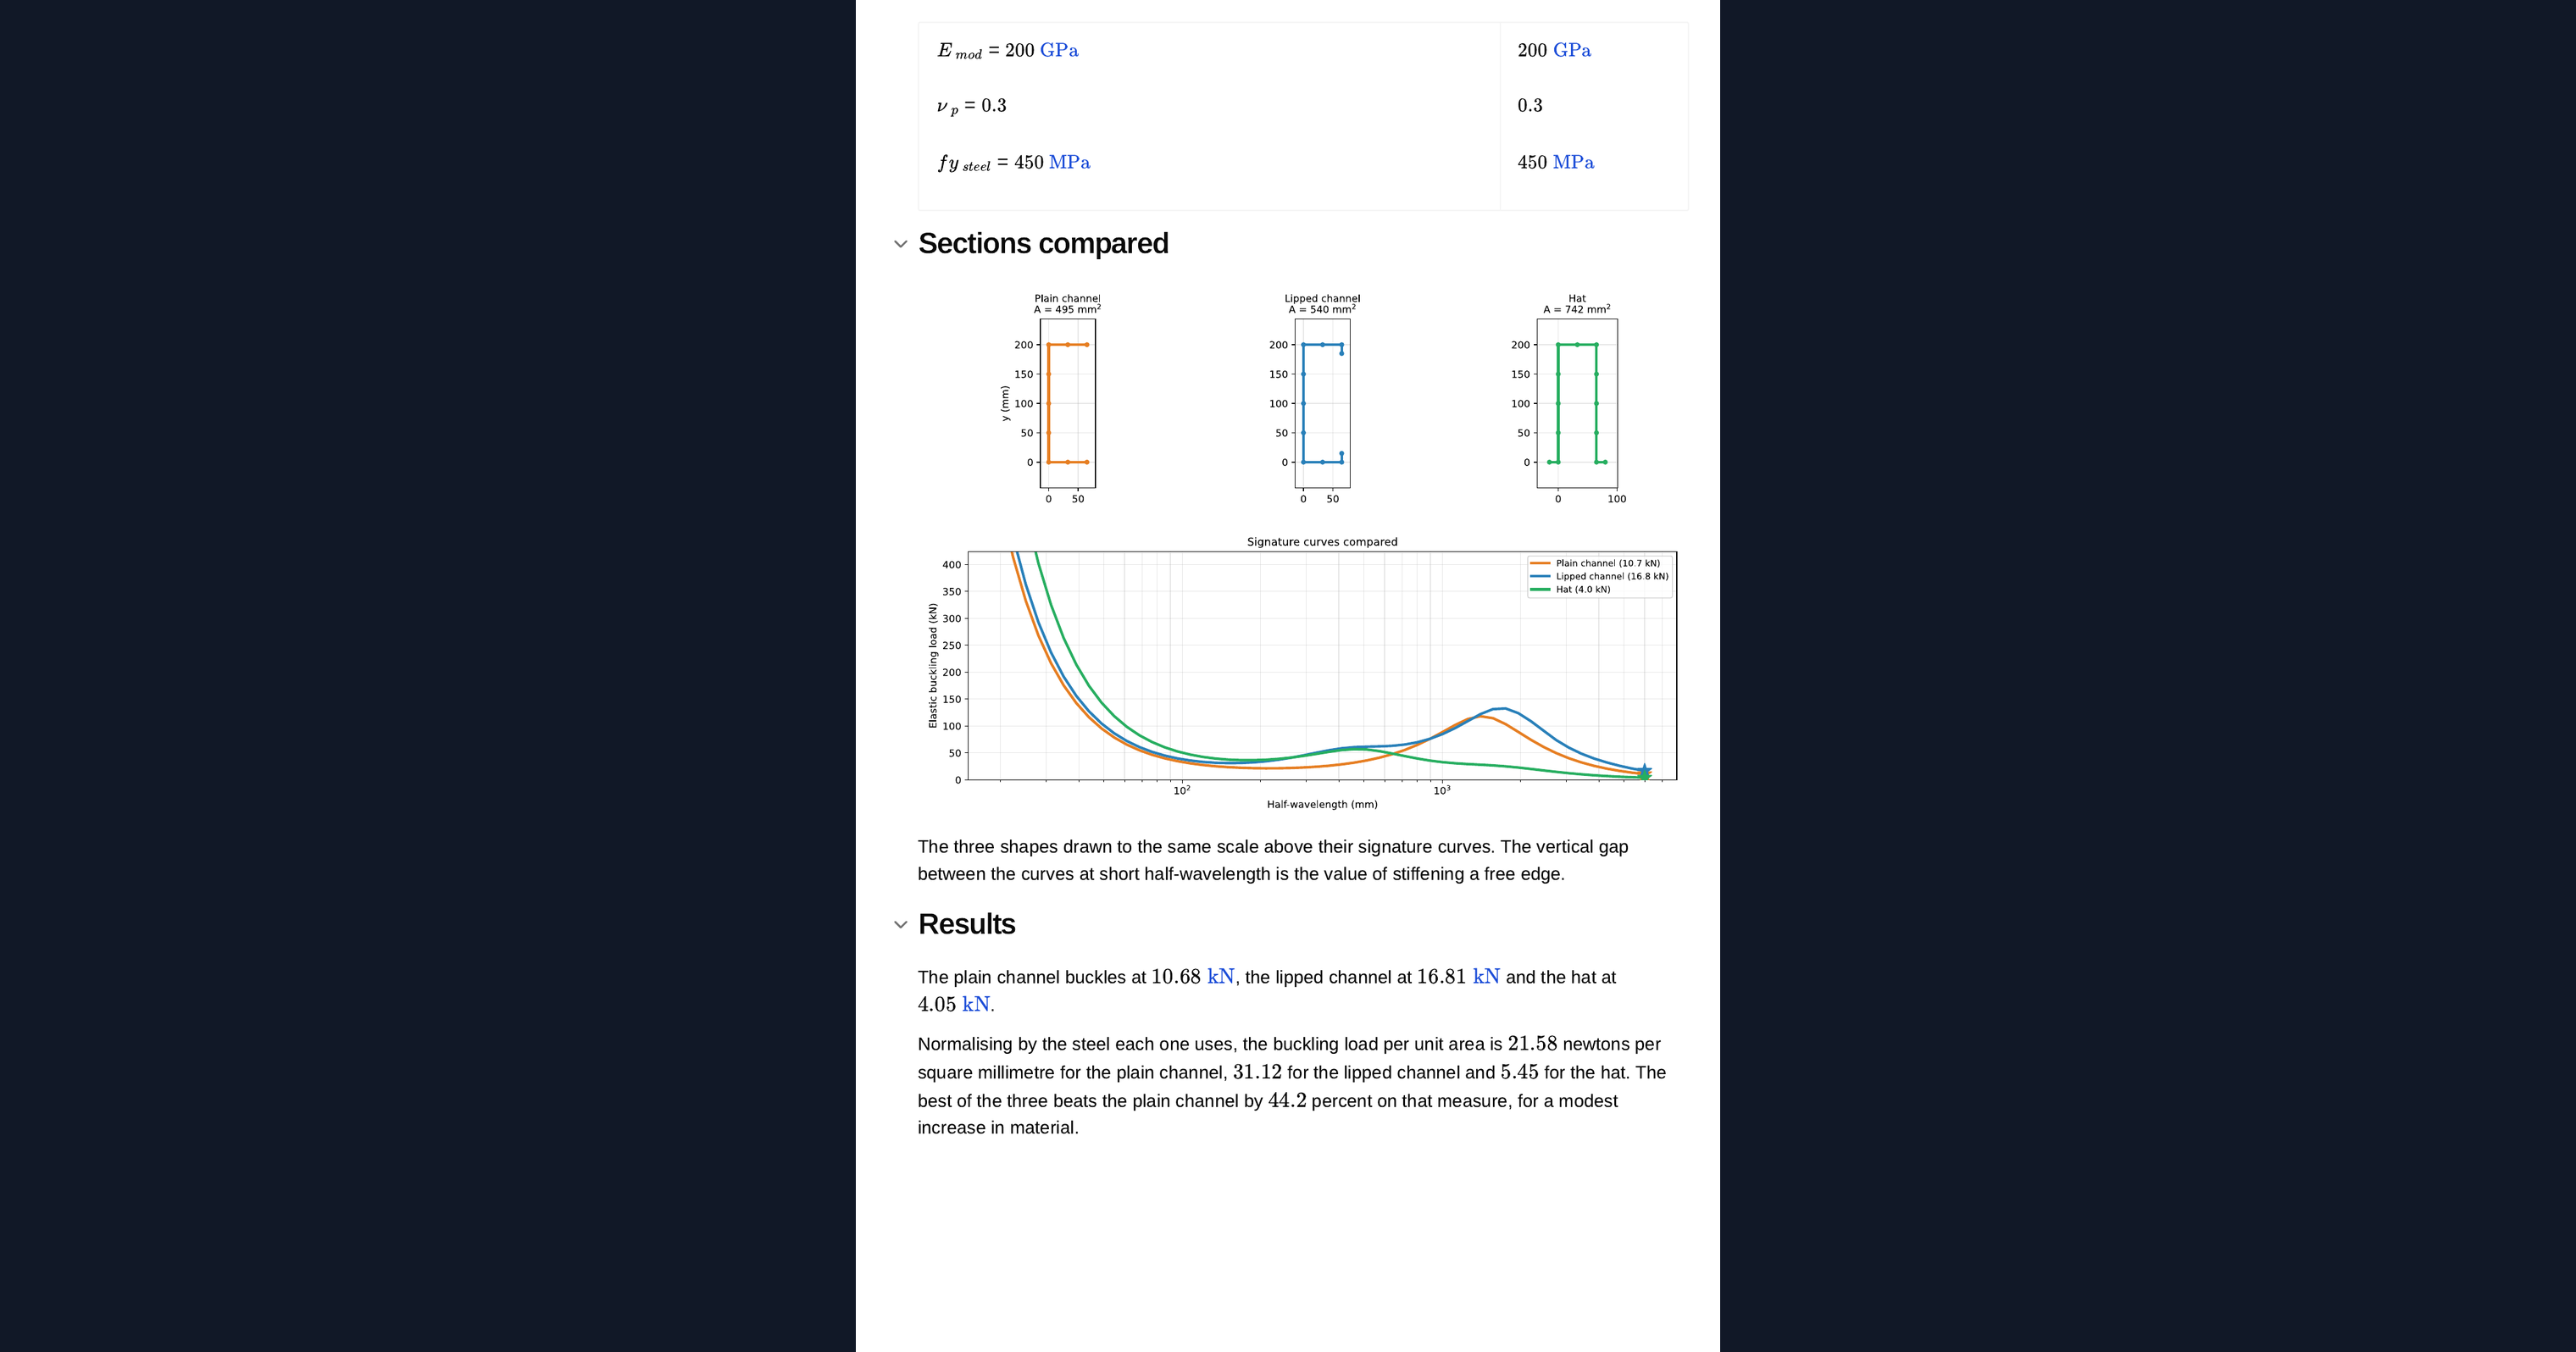
This page takes three cold-formed shapes built from the same flat sheet thickness and the same web depth, and compares them on the one thing that decides how much load a thin-walled section carries: elastic buckling. A finite strip analysis runs on each section in the page using pyCUFSM, and the signature curves are plotted together so you can read how each shape behaves across the full half-wavelength range.
Why the flange edges decide everything
All three sections share a thickness and a web depth. What differs is how the free edges of the flanges are treated, and for a thin-walled member that is the dominant question.
- Plain channel — two free edges. An unstiffened element with a free edge buckles at a low stress, so the flanges give way early and drag the section's capacity down with them.
- Lipped channel — each free edge is folded into a short return, turning it into a stiffened edge. The flange can no longer buckle without carrying the lip, which raises the local buckling load sharply and introduces distortional buckling as a separate, longer-wavelength mode.
- Hat — both flanges turn the same way, so the section becomes singly symmetric about a vertical axis with the two lips acting together. It is stiffer in torsion than an open channel of the same material and behaves differently again in global buckling.
Load per unit area
Comparing raw buckling loads is only half the story, because the three sections use slightly different amounts of steel. The comparison that matters commercially is the buckling load per unit area, which is reported alongside the raw figures.
Limits and caveats
This is a comparison of elastic buckling, not of design capacity. The ranking can change once the Direct Strength Method is applied, because the strength curves treat local, distortional and global slenderness differently and post-buckling reserve is not the same in each mode.
The three sections are not identical in area, and the hat in particular is a different structural animal: it is symmetric about a vertical axis rather than a horizontal one, so its global buckling behaviour and its response to bending are not directly comparable to the two channels. The per-unit-area figure is a fair first cut, not a substitute for designing each section for its real load case.
The critical load reported for each shape is the minimum over the whole half-wavelength range, which for a long enough range is global buckling. For a real member, read each curve at the actual unbraced length instead.
Because it runs a real finite strip analysis in the page, this calculation handles arbitrary geometry entered as a table rather than a fixed standard case, and returns diagrams and contour plots alongside the numbers.
Engineering templates
Common calculators
Design guides




Frequently asked questions
What does this calculation actually compare?
It compares the elastic buckling behaviour of a plain channel, a lipped channel and a hat section that share the same sheet thickness and web depth. A finite strip analysis produces a signature curve for each, and the three curves are plotted together.
Which section carries the most load?
It depends on what you read from the curve. Adding lips to a plain channel raises the local buckling load sharply and adds a distortional mode; the hat is stiffer in torsion again. The page also reports the buckling load per unit area so you can compare sections that use slightly different amounts of steel on a fairer basis.
Is this the same as a design check?
No. This is elastic buckling only, not design capacity. Once the Direct Strength Method is applied the ranking can shift, because local, distortional and global slenderness carry different post-buckling reserve. Treat these results as insight into behaviour, not as a final capacity.
Why is the hat not directly comparable to the channels?
The hat is singly symmetric about a vertical axis rather than a horizontal one, so its global buckling and its response to bending differ from the two channels. The per-unit-area figure is a reasonable first cut, but each section should still be designed for its own load case.
What is the reported critical load?
It is the minimum over the whole half-wavelength range, which for a long enough range corresponds to global buckling. For a real member you should read each curve at the actual unbraced length.
Can I use my own geometry?
Yes. Because the page runs a live pyCUFSM finite strip analysis, you can enter arbitrary geometry as a table rather than being limited to a fixed standard case, and get diagrams and contour plots alongside the numbers.
Learn about the benefits of using CalcTree on engineering projects!