Picking building massing on a site near a runway is a scheme-stage decision with two aviation constraints sitting on top of it. Does the building intrude into protected airspace, and does it throw turbulence across the runway. Ground-level wind amenity pulls the other way. You want to rank the options before anyone commissions CFD or a wind tunnel.
The usual way that gets done is three or four spreadsheets, each holding its own copy of the runway setback, and a summary slide assembled by hand at the end. Change the setback and you are re-checking every file to find out what moved.
We built the same job in CalcTree as four connected pages, with the heavier analysis running as Python on our cloud execution engine inside the pages themselves. It is a good demonstration of what the connected structure is actually for. Here is how it works.
Pages reference other pages
The pack is four pages: a design basis, a geometry check against the obstacle limitation surface, a wake and turbulence screen, and a flow-field and optioneering summary. The overview page links to each of them, and those links are live page references, not pasted URLs.
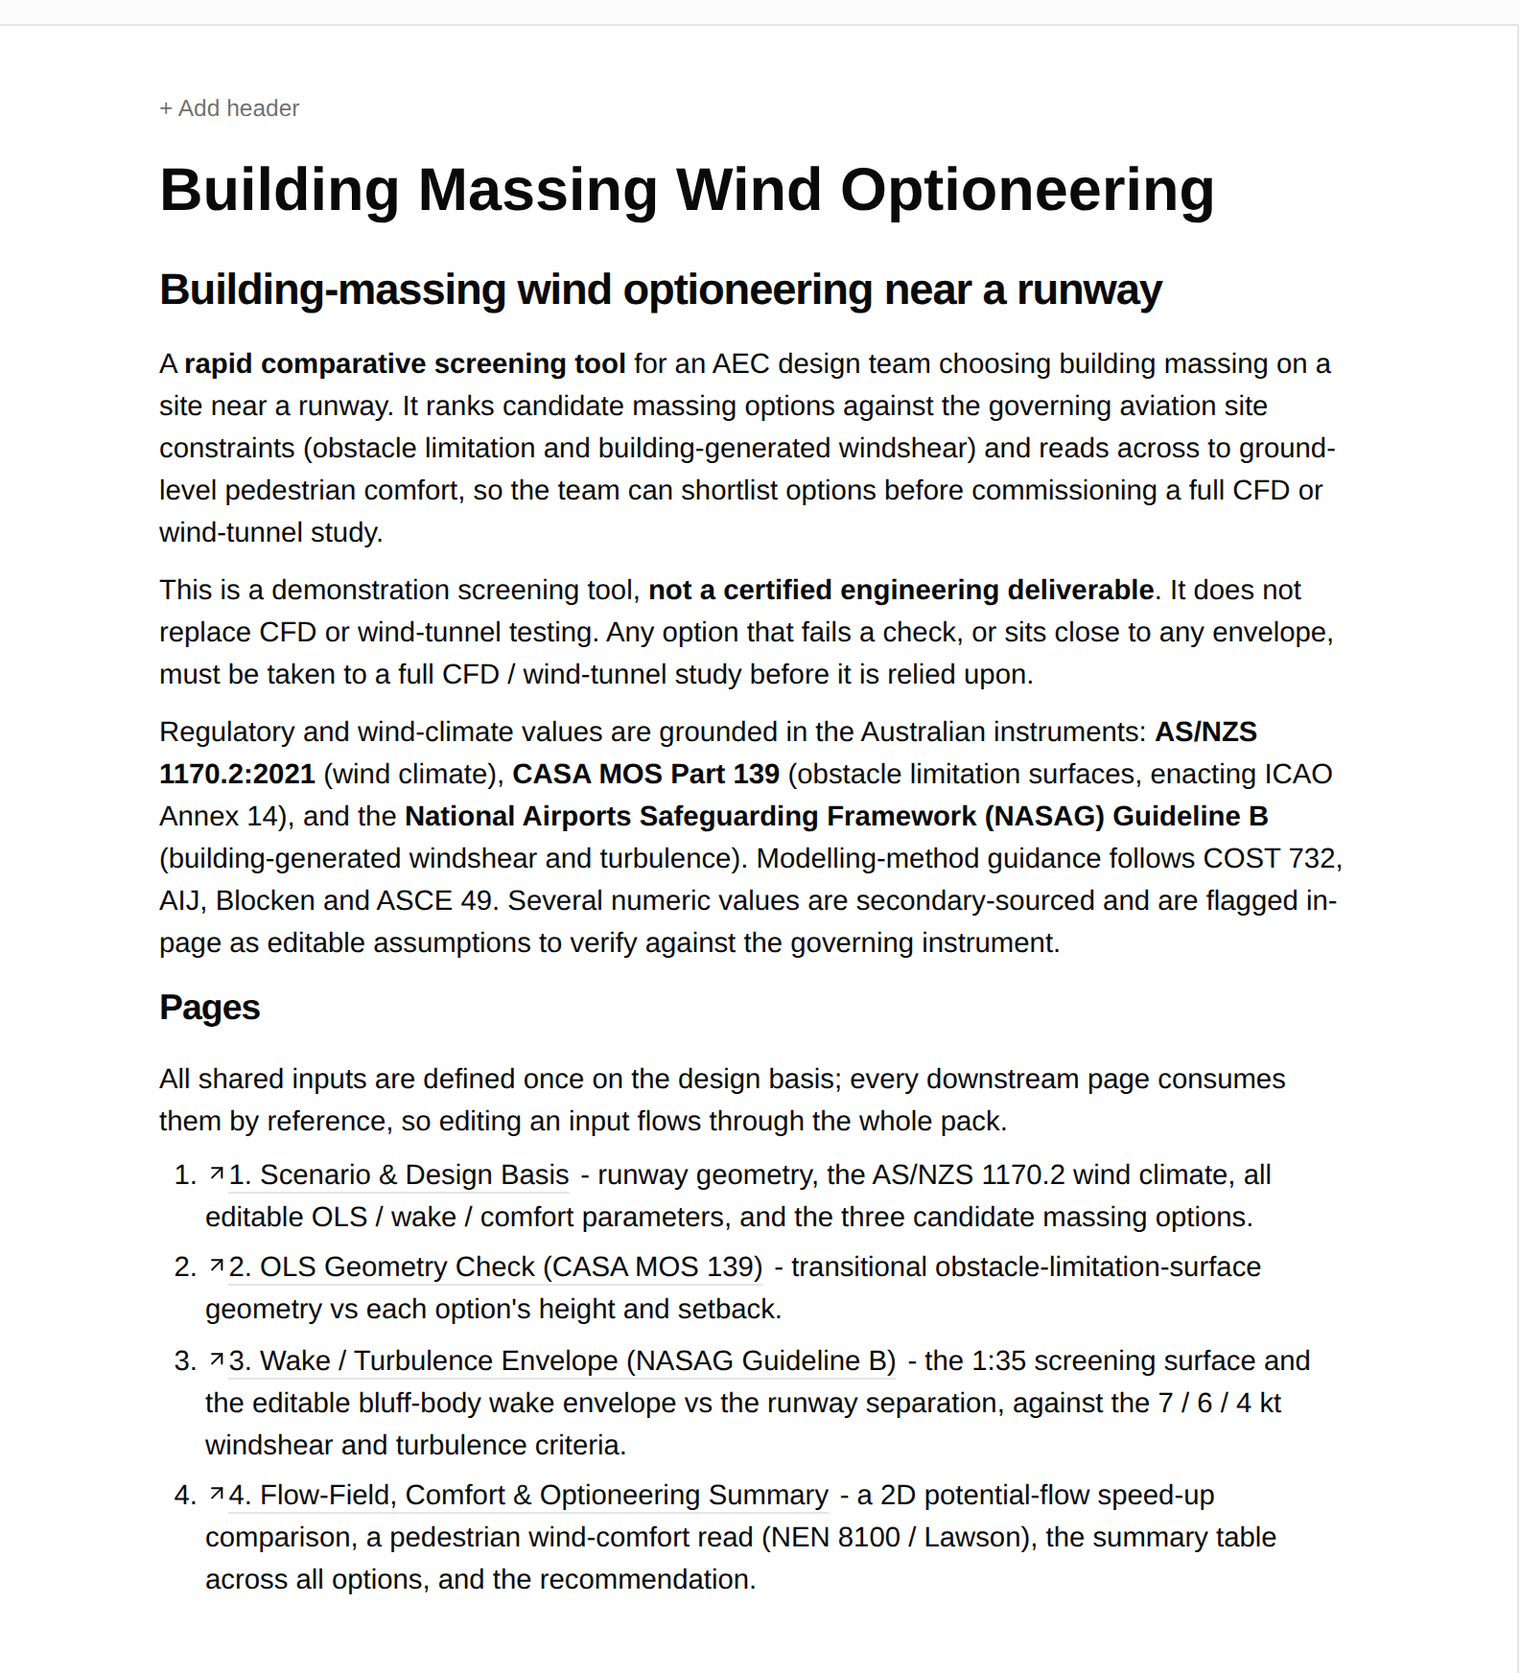
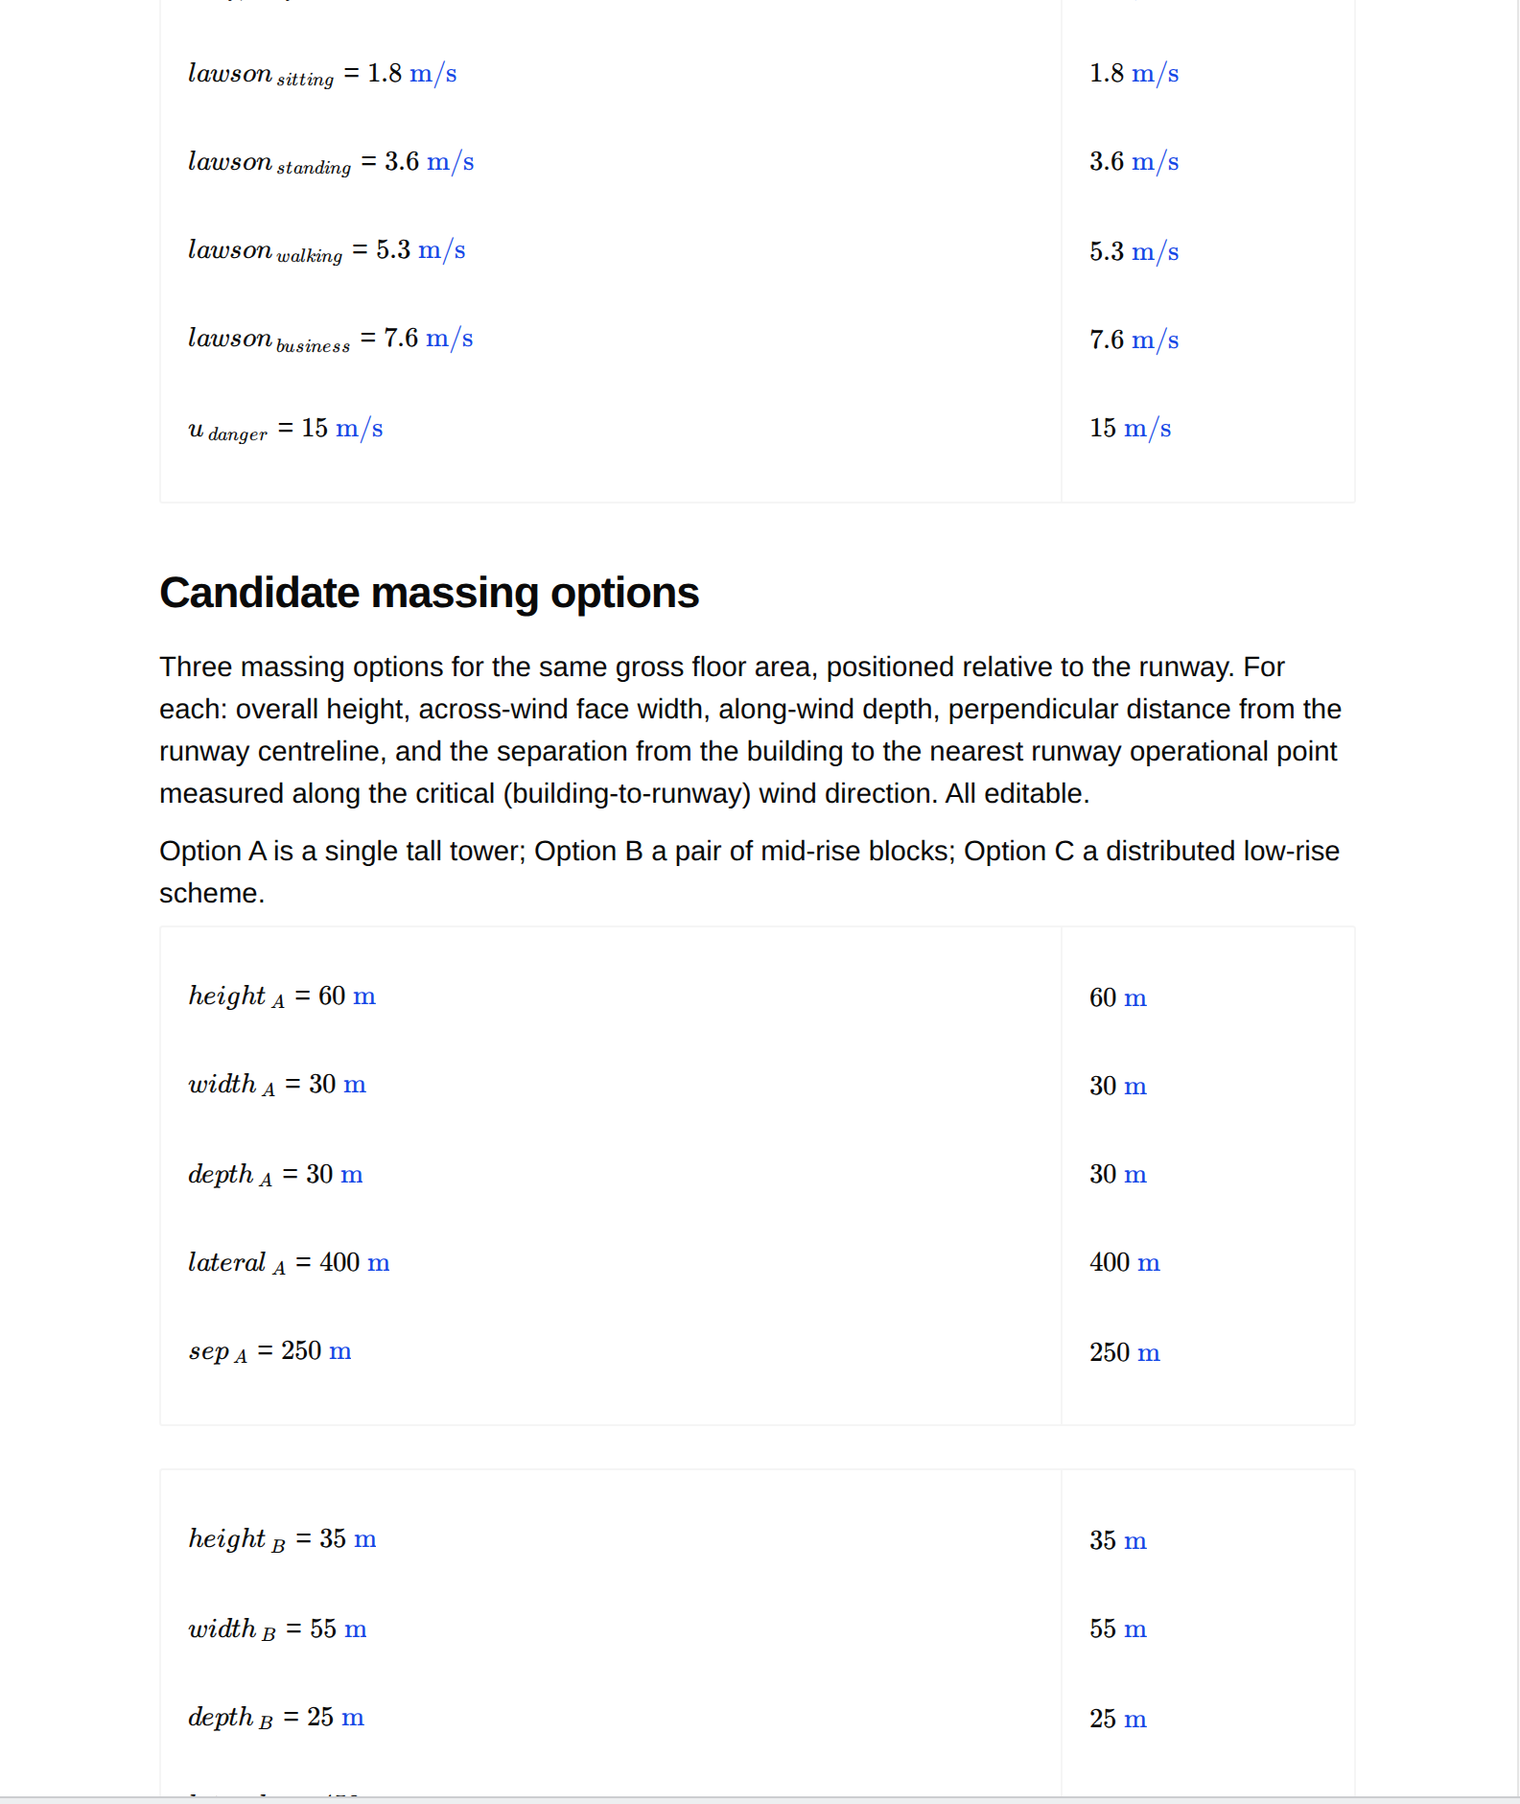
The important part is underneath. Every shared input is defined once on the design basis: the wind climate, the runway strip half-width, the transitional slope, the wake multipliers, the comfort thresholds, and the three candidate massings. Nothing downstream redefines any of it. The other three pages read those values by reference.
So a change upstream flows through the documents downstream. Edit the strip half-width on the design basis and the geometry check, the wake screen, the Python charts and the summary table all recompute against the new value. There is no re-entry step and no second copy to fall out of date.
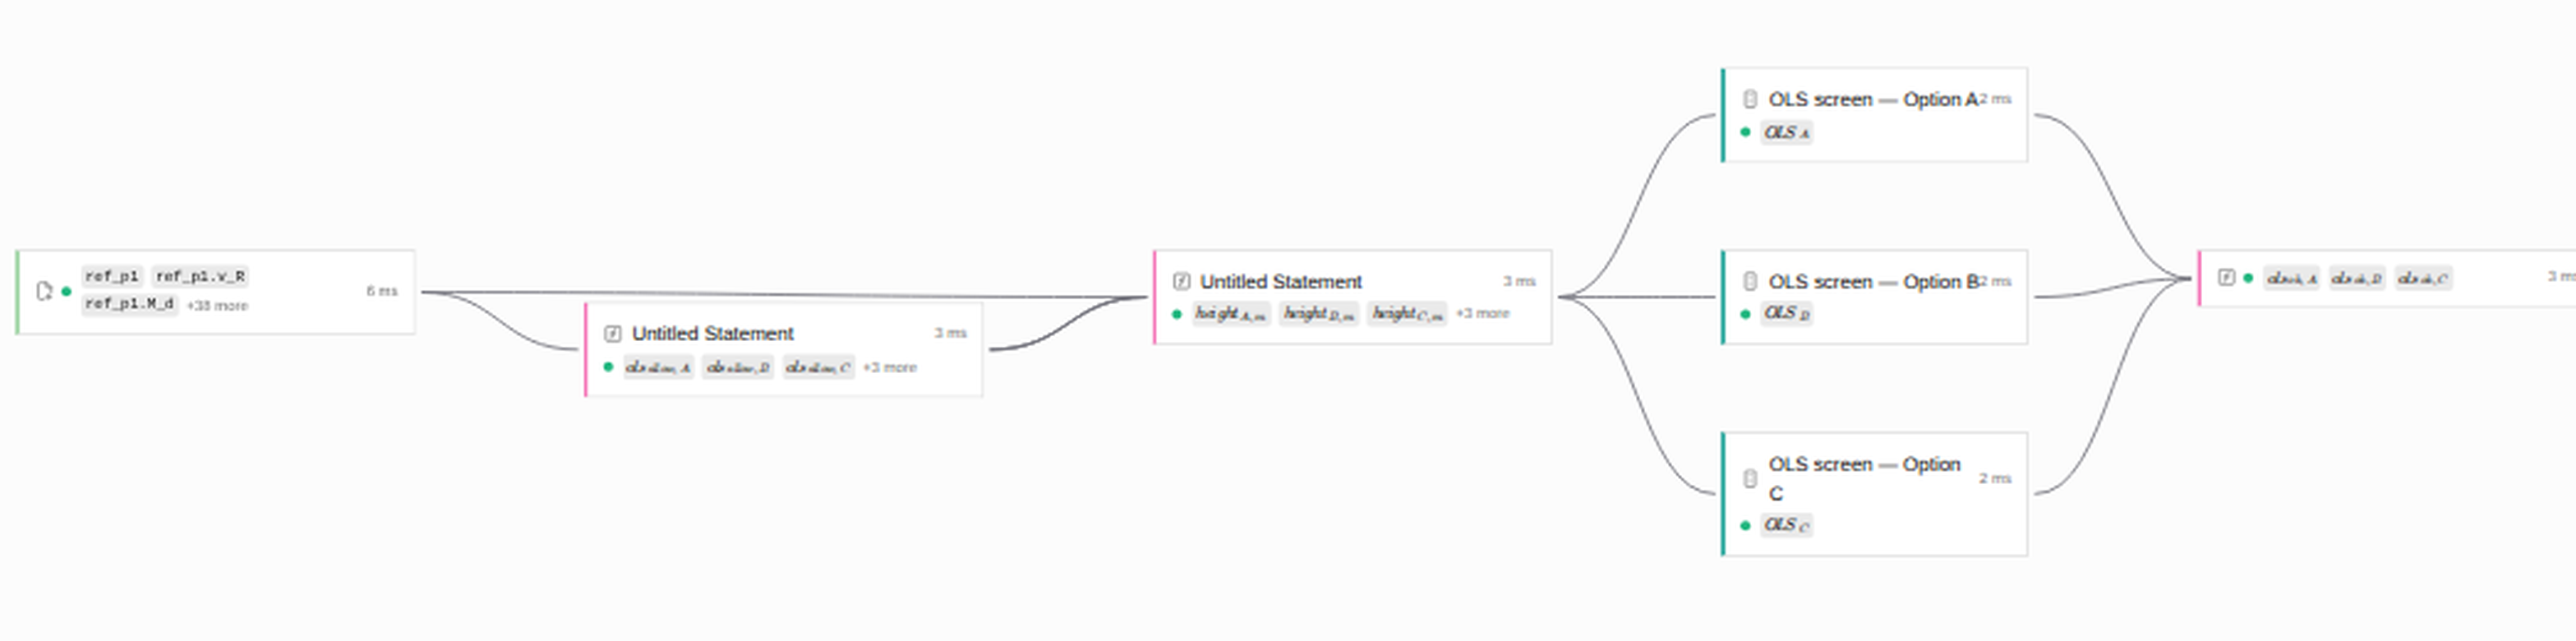
Open the page reference in that graph and you can see exactly what is crossing the boundary: which page it points at, its status and run time, and every value it brings with it.
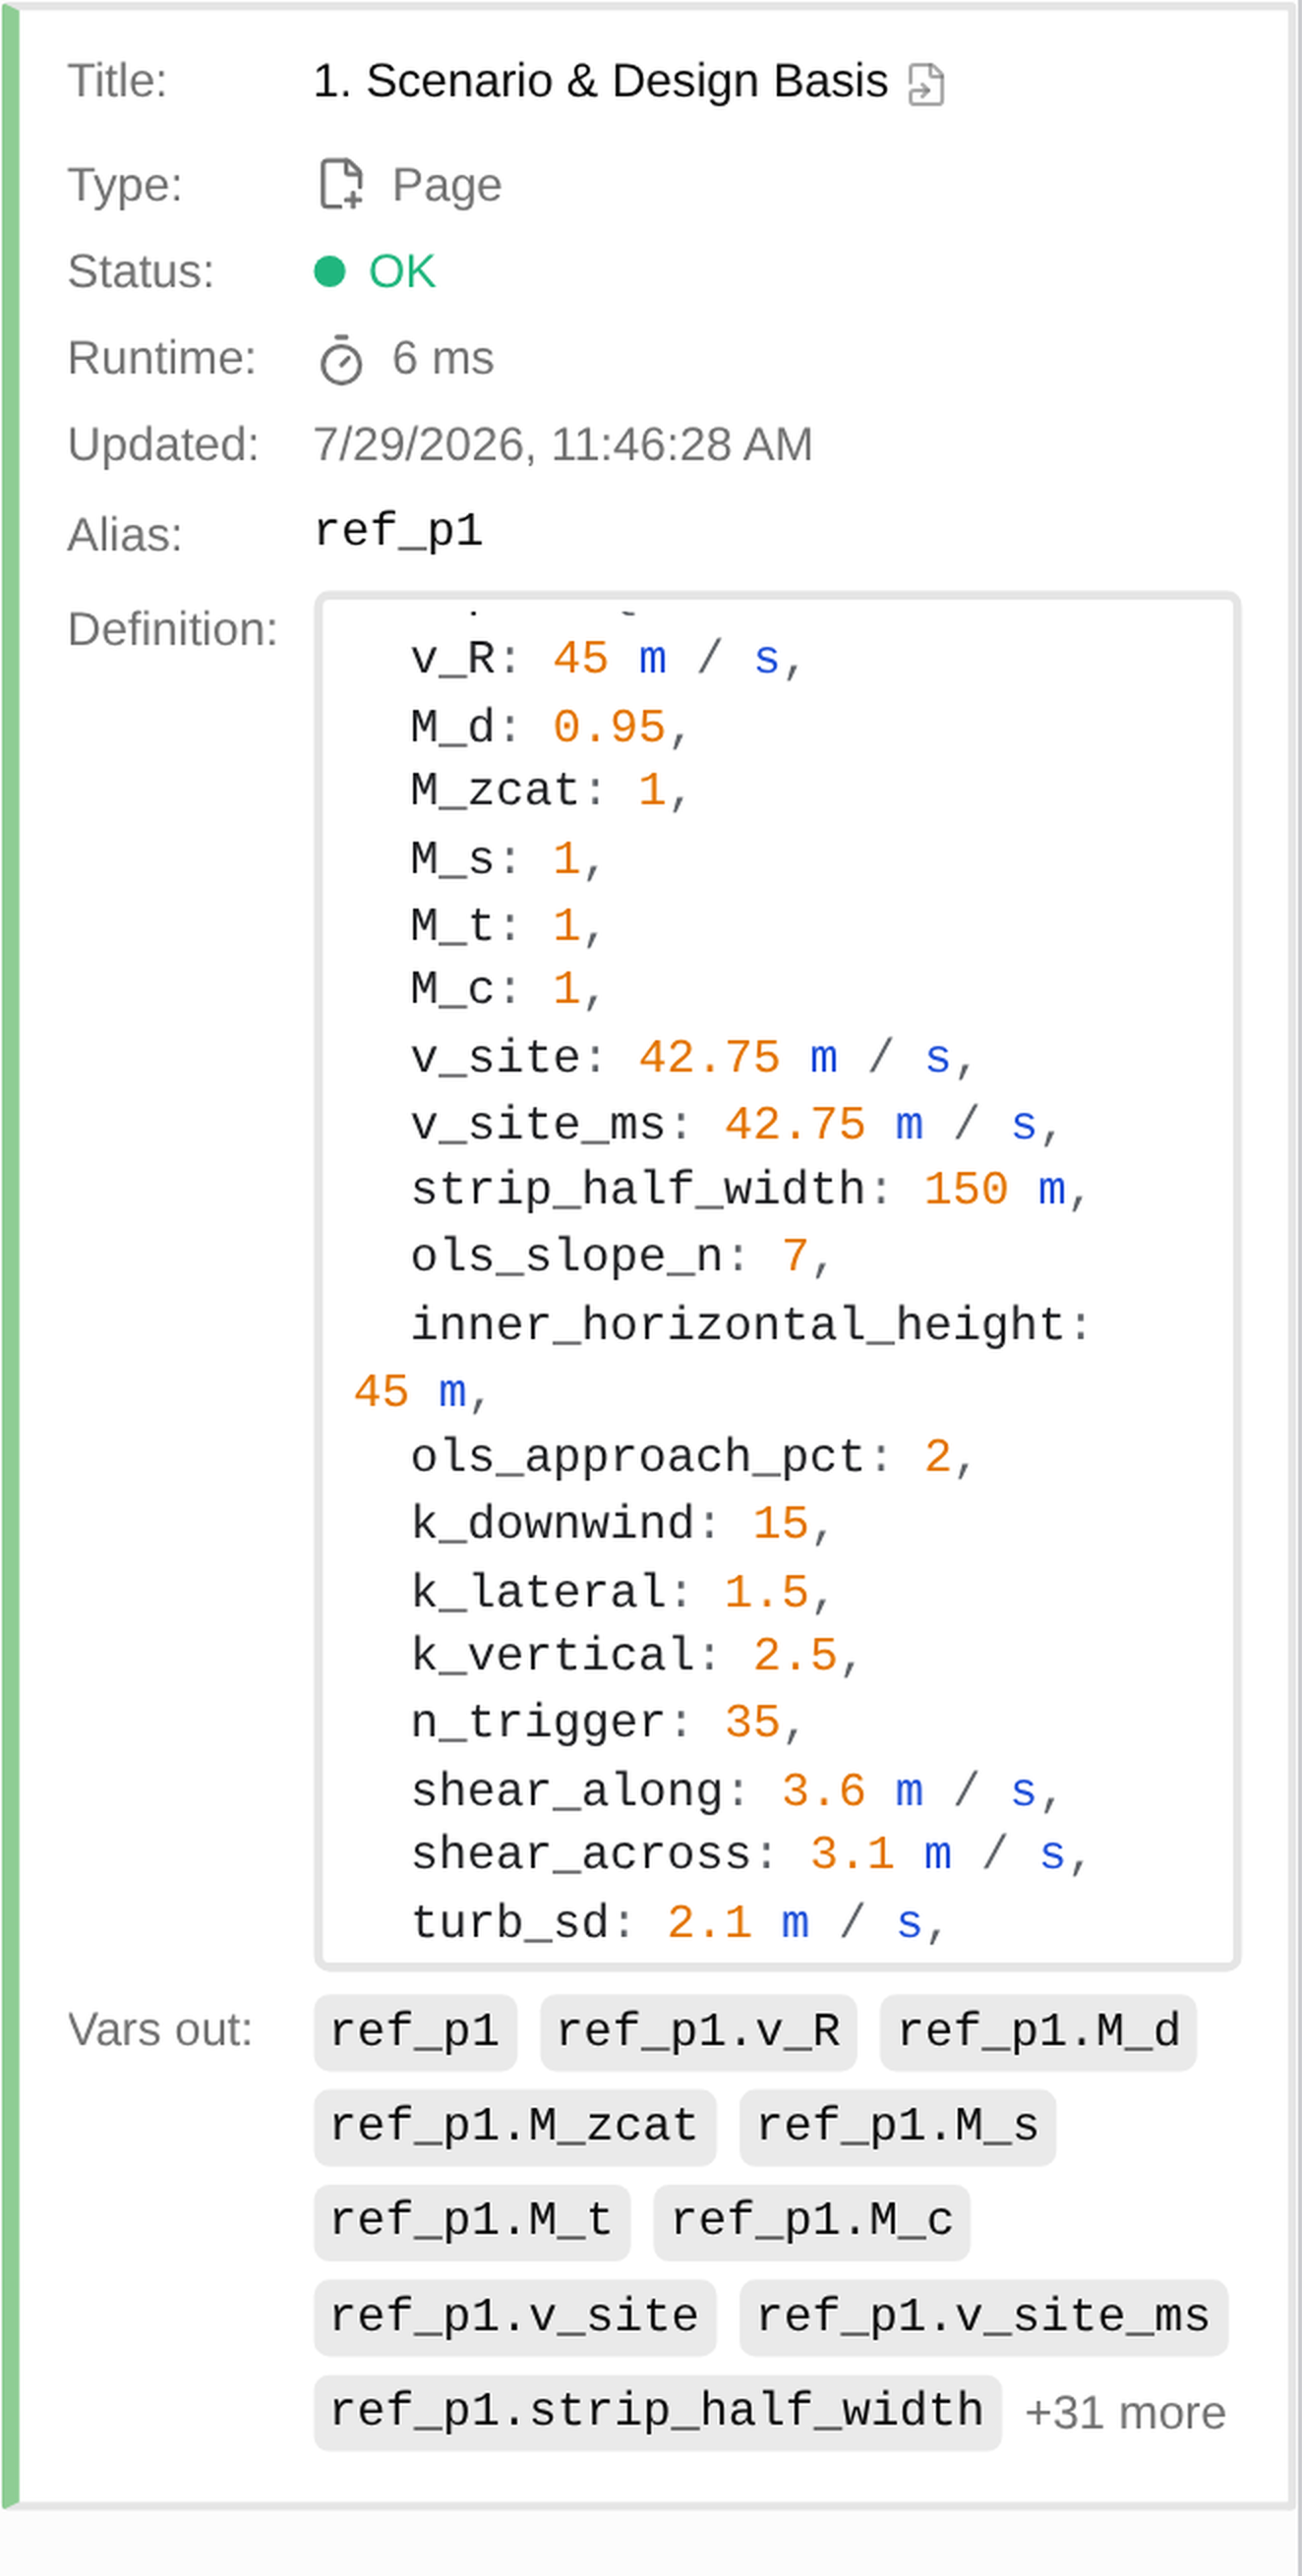
The dependency graph shows what depends on what
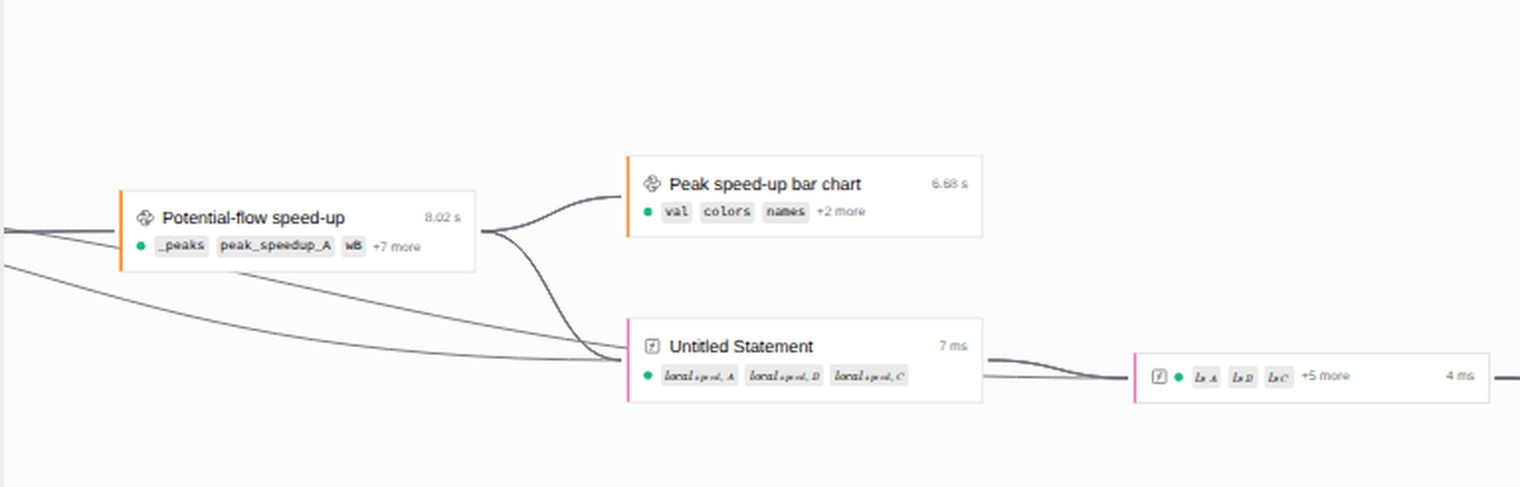
Every calculation on a page is a node, and the graph draws the edges between them. You can see which inputs feed which check, where a value is consumed, and how long each node took to run. When a review question is "what does this number depend on", that is the answer, rather than a trace through someone's cell references.
Python runs in the cloud, in the same scope as the maths
Where the maths notation runs out, you write Python. In this pack the ground-level flow field is a 2D potential-flow model: a uniform freestream with one doublet per building footprint, solved with numpy and plotted with matplotlib. It runs on our infrastructure, so there is no environment to install and nothing to deploy.
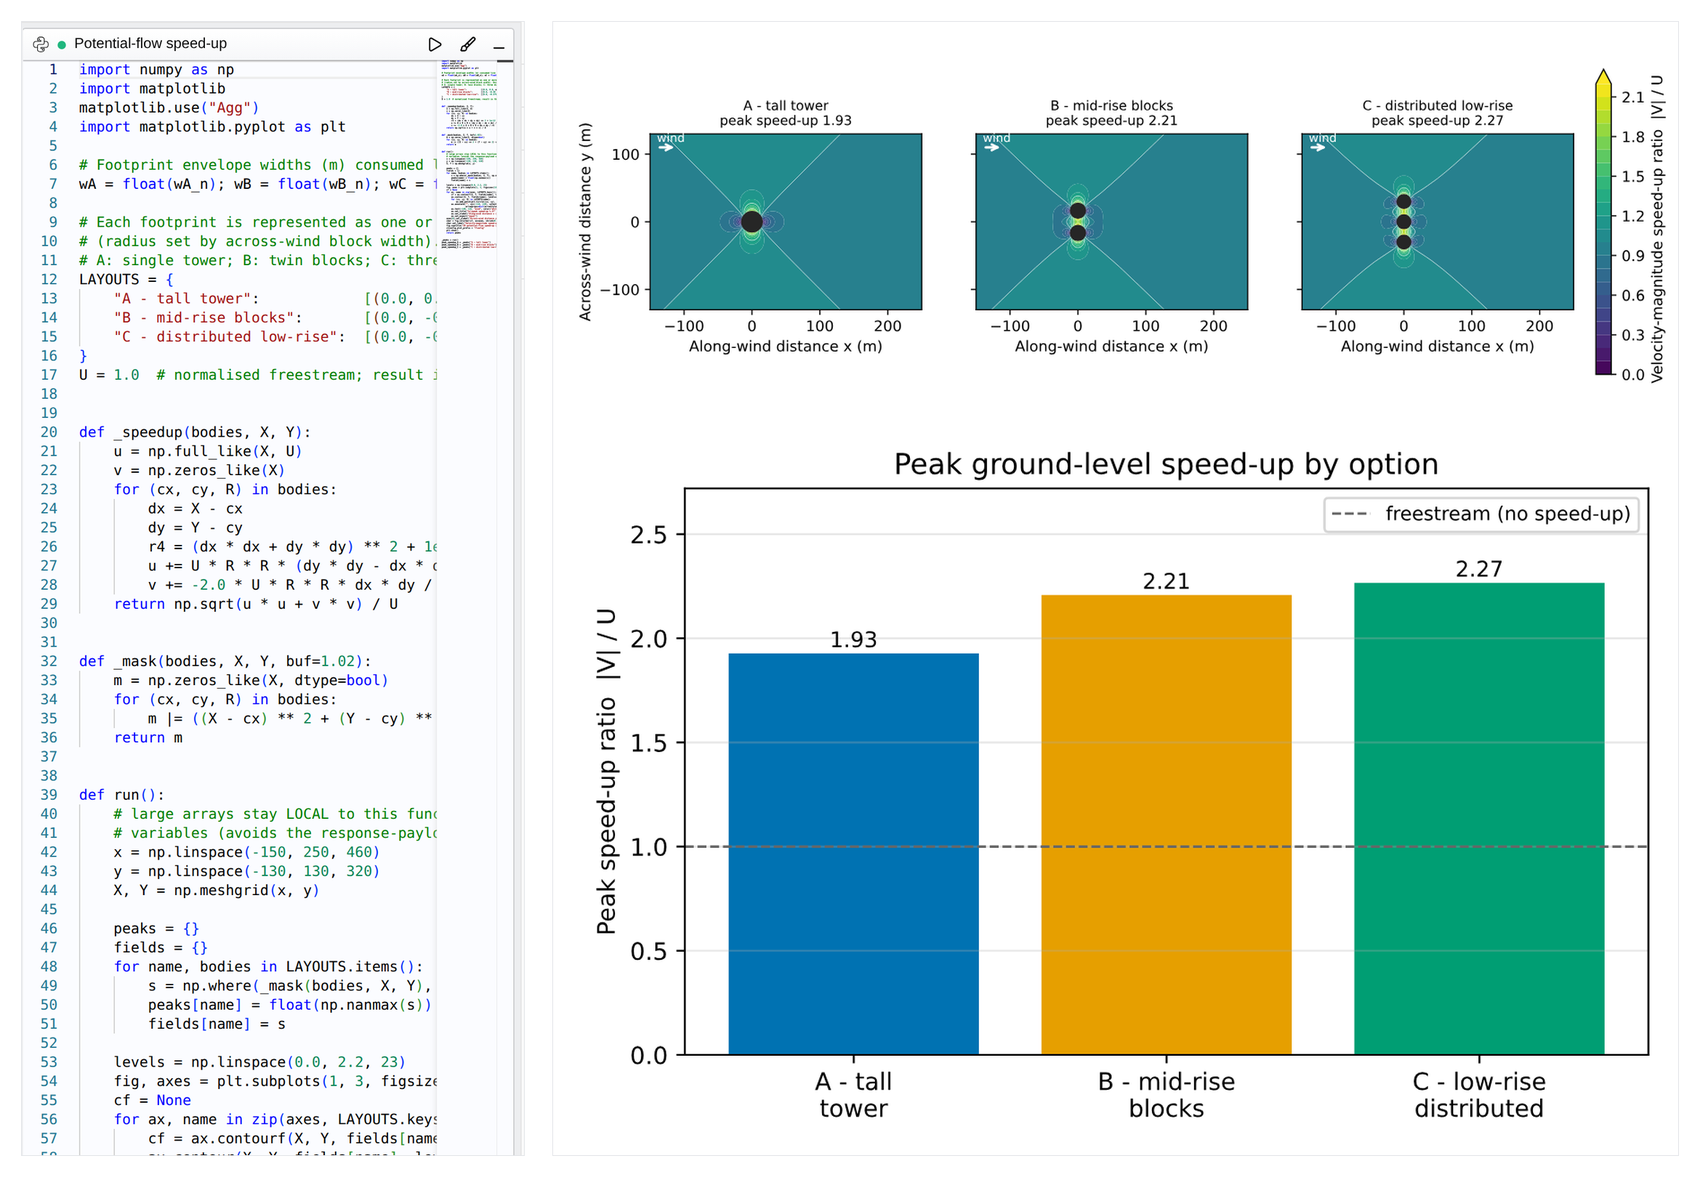
It shares one scope with the rest of the page. The Python reads the footprint widths from the design basis by name, and it writes the peak speed-up for each option back out as page variables, which the notation on the same page then picks up to work out the local pedestrian speed and classify it. Maths feeds Python feeds maths, with no export in the middle.
Everyone works in the same workspace
The pack is not a file that gets emailed around. It lives in a shared workspace, several people can be in the same page at once, and each page carries its own version history, so a reviewer can see what changed and when. Checking a colleague's assumption means opening the page they wrote it on, not asking which version of the spreadsheet is current.
The whole set binds into one report
Pick the pages you want, order them, and the report renders as one document with a live preview. Every input, formula, result table and chart appears in document order.
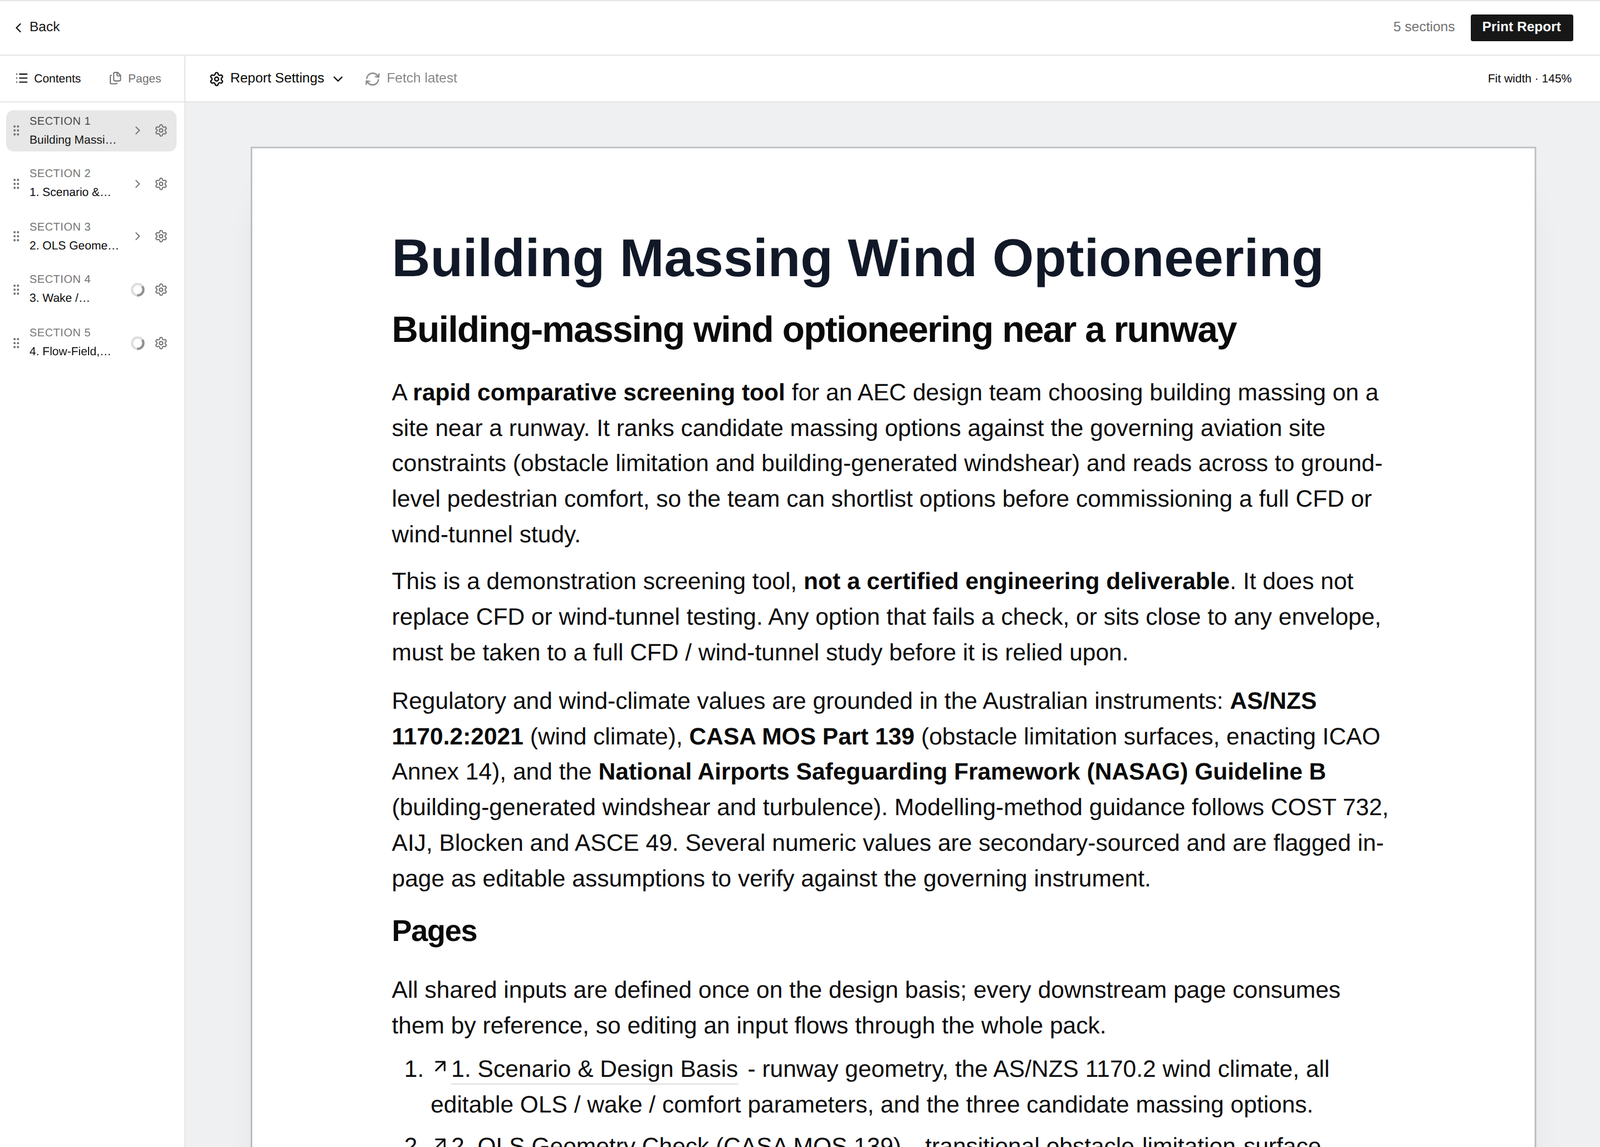
Because the report is generated from the calculation rather than assembled beside it, it is correct by construction on every run. Here is the exported report from this pack (PDF, 15 pages).
The knowledge bundle behind it
None of the engineering in this pack came out of a model's general recall. Before writing any of it we assembled a wind-design knowledge bundle from industry-accepted practice and publicly available documents, and the pages were written against that.
It is two written reference pages plus three structured datasets, sixty rows in total. Each row carries a parameter, the recommended value, a note on the conditions it applies under, the source it came from, and the clause or section within that source. Split by subject:
- Australian wind climate (8 rows): the AS/NZS 1170.2:2021 chain from regional gust speed through the direction, terrain, shielding, topographic and climate multipliers to a site wind speed, with the ARI selection pointing back to AS/NZS 1170.0.
- Aviation obstacle limitation and building-generated turbulence (27 rows): the obstacle limitation surfaces and their slopes clause by clause, the NASAG assessment trigger area, the 1:35 screening surface, the 7 / 6 / 4 kt criteria, and the bluff-body wake length scales from the wind-engineering literature.
- CFD and wind-tunnel best practice (25 rows): domain sizing and blockage, grid resolution and convergence, inlet boundary conditions, turbulence-model choice and its limits, and the pedestrian comfort criteria.
The primary sources it is built on, all publicly available:
- CASA Part 139 (Aerodromes) Manual of Standards 2019 on the Federal Register of Legislation, for the obstacle limitation surfaces. Clause structure confirmed against the primary instrument, not a secondary summary.
- NASAG Guideline B, Managing the Risk of Building Generated Windshear and Turbulence at Airports (May 2018), for the trigger area, the 1:35 surface and the acceptance criteria.
- AS/NZS 1170.2:2021, Structural design actions Part 2: Wind actions, for the wind climate.
- Tominaga et al. (2008), the AIJ guidelines for practical applications of CFD to pedestrian wind environment around buildings, and the COST Action 732 best practice guideline (Franke et al. 2007), for modelling method.
- Blocken (2014), 50 years of Computational Wind Engineering, for what steady RANS can and cannot resolve in a wake, which is why this pack is framed as comparative rather than absolute.
- ICAO Annex 14 Volume I as the parent framework, the ASHRAE Handbook chapter on airflow around buildings (after Wilson 1979) and the Hosker / Fackrell downwash formulation for wake geometry, NEN 8100 and the Lawson criteria for comfort, and ASCE/SEI 49-21 for wind-tunnel testing.
The part that matters for trust is what happens where a value is secondary-sourced. Those rows are flagged in the bundle with a note to verify against the governing instrument, and that flag carries through to the page: the value is presented as a stated, editable assumption with the caveat visible, rather than being quietly hardened into a constant. The pages cite the code or standard by name, never the bundle.
AI that can see the calculation
That bundle is what the AI assistant works against, alongside the page itself. It reads what is already defined, drafts the next block in the same notation, and answers questions about the pack with the actual variables in front of it. The difference between an assistant that is generically helpful and one you can put in front of a reviewer is almost entirely what you grounded it in.
What the screen actually produced
Three massing options for the same floor area, at their assumed setbacks:
- Option A, single tall tower (60 m): penetrates the transitional obstacle limitation surface by 24.3 m, and its estimated wake reaches the runway operational area. Weakest option against the aviation constraints.
- Option B, paired mid-rise blocks (35 m): clears the surface with 7.9 m to spare, but its wake still reaches the runway, so it would need a full windshear and turbulence study.
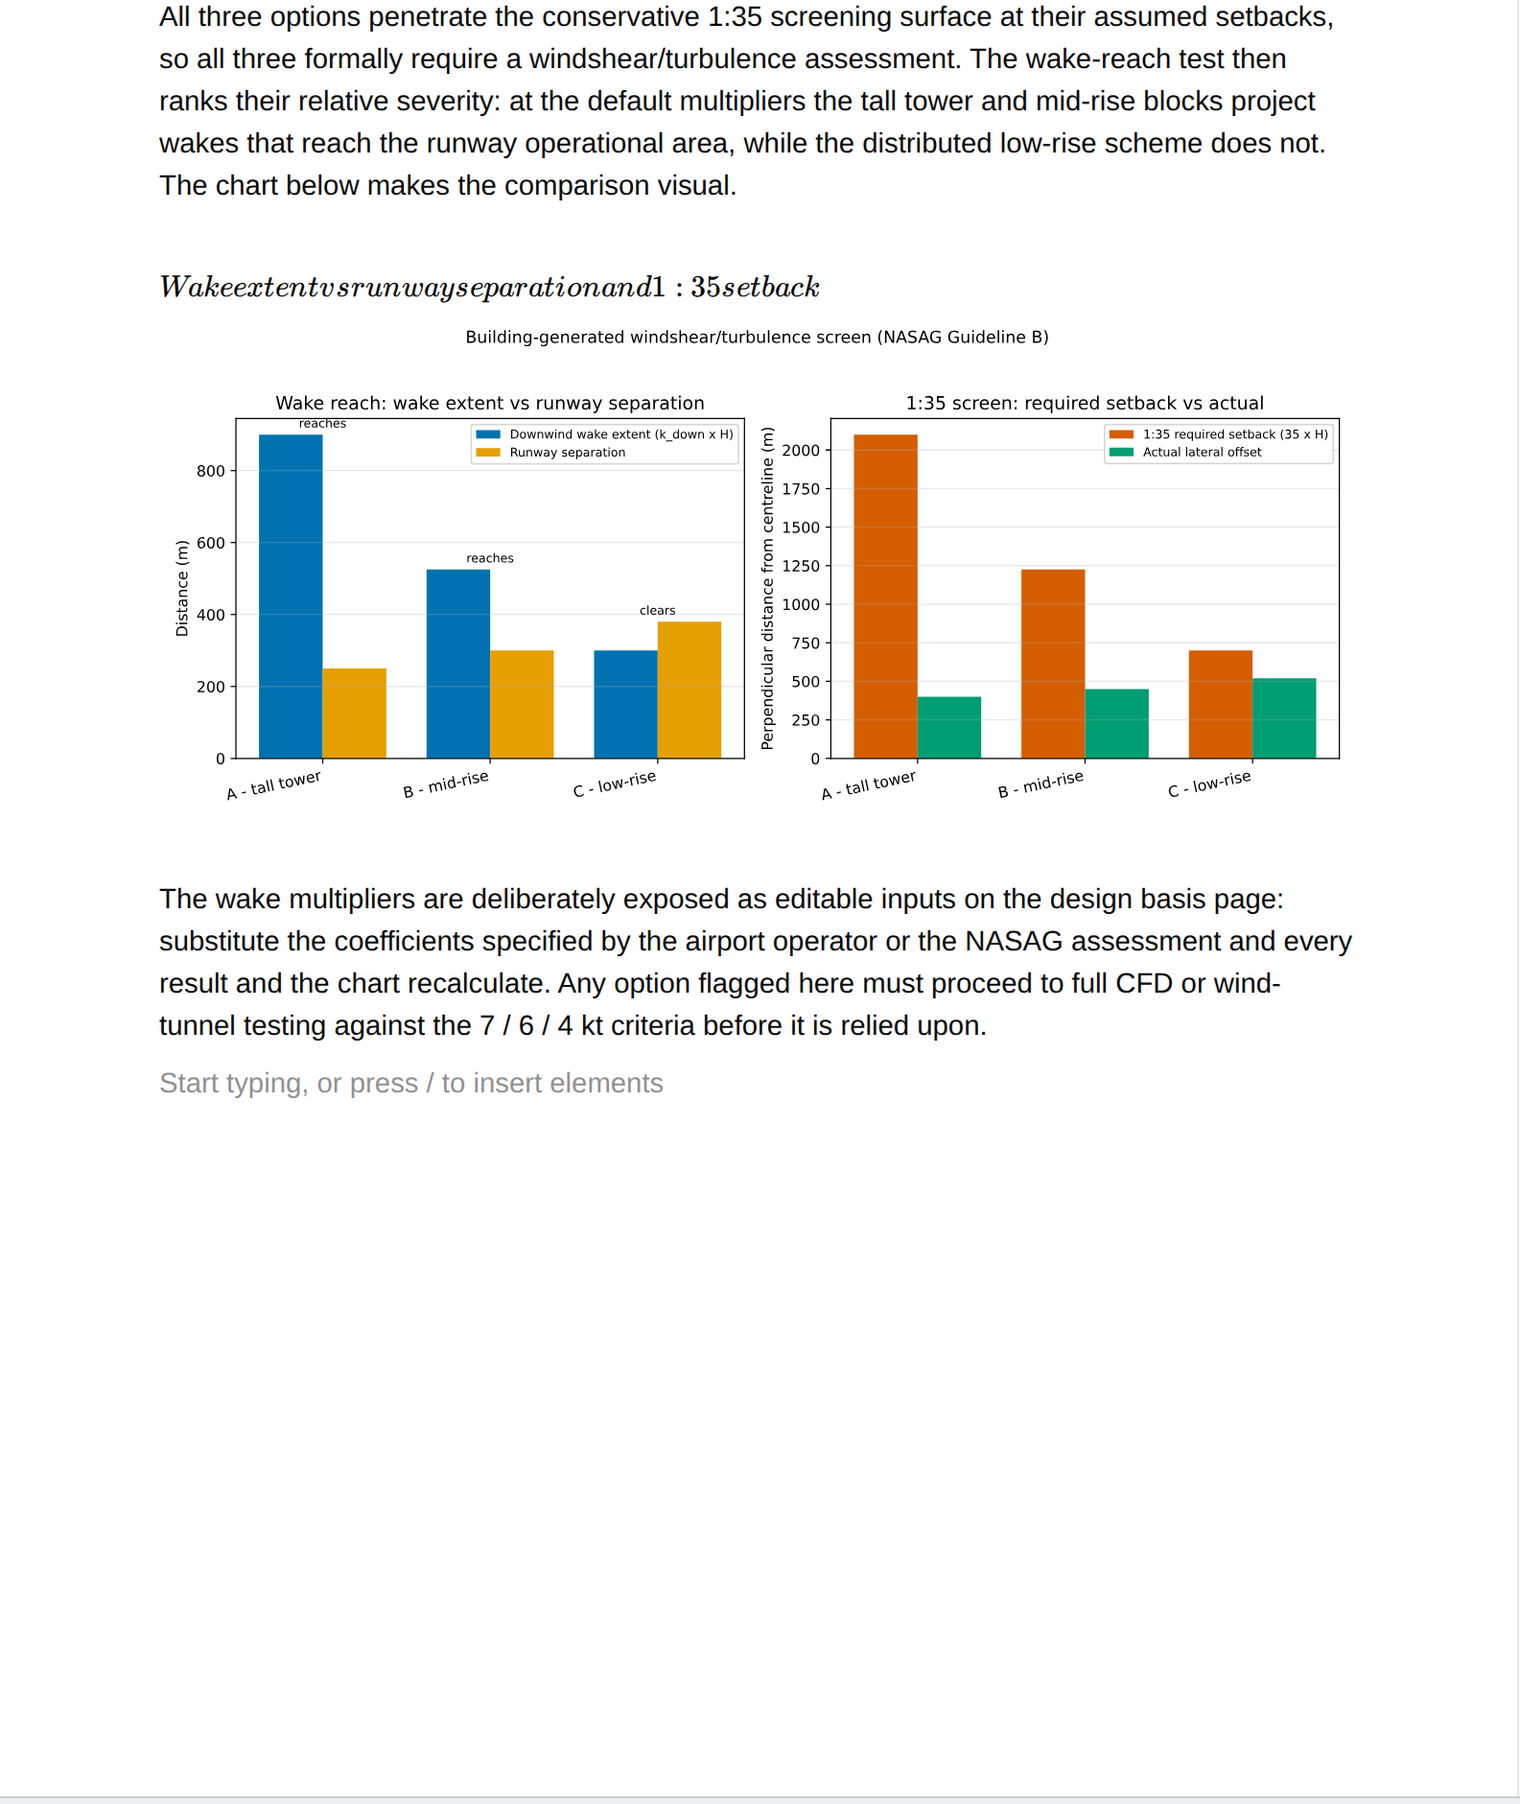
- Option C, distributed low-rise (20 m): clears the surface, and its wake does not reach the runway operational area at the configured multipliers. The most defensible aviation choice on this screen.
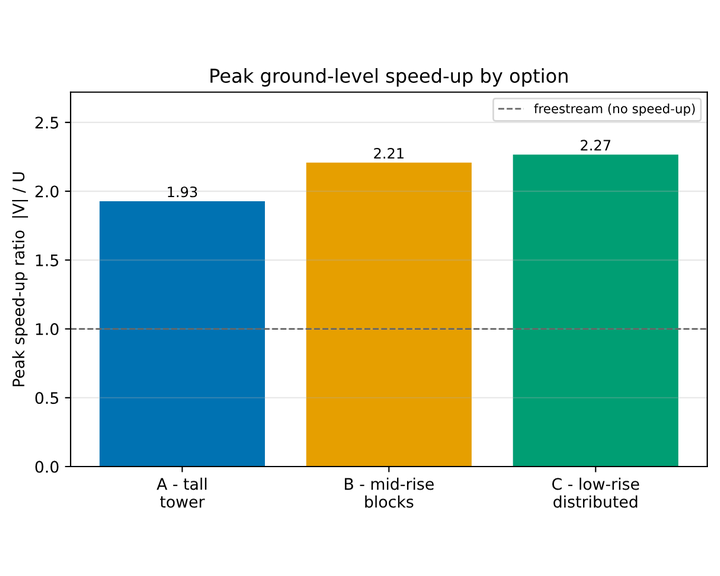
Ground level runs the other way. The distributed and mid-rise schemes produce the highest pedestrian-level speed-up in the gaps between blocks, so whichever massing goes forward, ground-level mitigation should be studied alongside it. All three penetrate the conservative 1:35 screening surface, so all three formally require a building-generated windshear and turbulence assessment.
The regulatory basis is the Australian instruments: AS/NZS 1170.2:2021 for the wind climate, CASA MOS Part 139 for the obstacle limitation surfaces, and the National Airports Safeguarding Framework Guideline B for building-generated windshear and turbulence.
What it is not
A rapid comparative screen, not a certified deliverable, and not a substitute for CFD or a wind tunnel. Potential flow is inviscid and irrotational: it shows speed-up, blockage and the venturi acceleration between separated blocks, and it cannot show flow separation, the downwind wake or turbulence. Read the contours as a relative comparison between options, not as absolute design wind speeds. Anything carried forward goes to a full study.
Where this goes next
Two directions, both of which follow from the structure above rather than replacing it.
The first is heavier analysis in the same place. Python already runs as a calculation engine inside a page, reading the design basis and writing results back for the notation to use. A solver like OpenFOAM can sit in that same slot: the page holds the geometry and the boundary conditions, the solve runs on our infrastructure, and the results come back as page variables that downstream checks and the report pick up automatically. Same wiring, heavier engine.
The second is connecting to the software already in use, so geometry arrives from the model and results go back out without anyone retyping them.