For engineers, logic verification is a daily necessity that is often the most painful part of the job. Whether you are performing a peer review or auditing your own work, tracing a result back through nested formulas and hidden spreadsheet tabs is a manual, high-stakes "treasure hunt."
When you're designing a concrete pad footing to ACI 318-19, the relationship between geometry, material properties, and flexural resistance isn't just a list of numbers—it’s a complex web of dependencies. Until now, that web has been invisible, buried under layers of cell-based logic.

The Problem: Manual Tracing
In standard documentation, calculation logic is often linear, but the thinking behind it isn't. Dependencies are often buried in spreadsheet formulas with cells referenced that requires multiple tiers of checking, making peer reviews a "treasure hunt".
The Solution: CalcTree Graph View
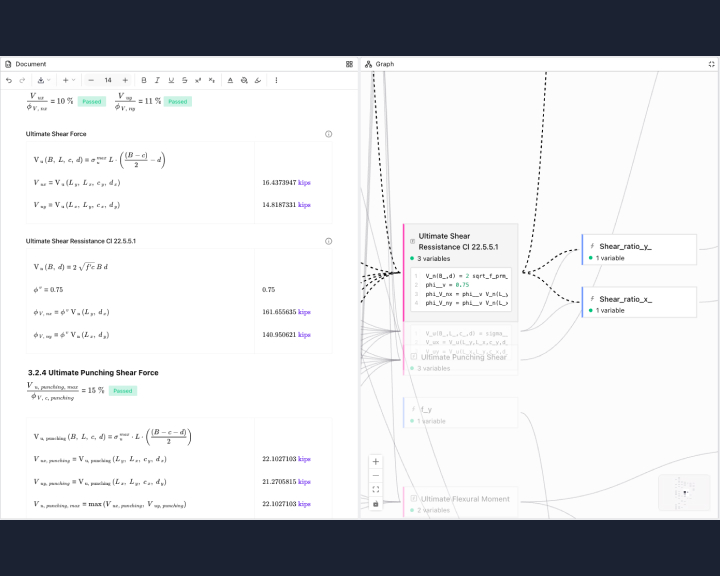
The Graph View provides a real-time, side-by-side visualization of your document’s logic.
- Bi-Directional Interaction: Clicking a node in the graph, takes you to where its positioned in the document.
- Structural Clarity: It separates inputs (Materials, Geometry) from derived calculations, making the hierarchy immediately apparent.
Our Graph View changes the verification experience entirely:
- Visual Traceability: Map every dependency from input to final output in a live, interactive DAG (Directed Acyclic Graph).
- Instant Verification: Select a calculation block in your document to highlight its specific logic path in the graph.
- Error Isolation: Quickly identify where a broken link or incorrect variable is impacting your downstream results.
Also released: Dark Mode
We understand that engineering design requires sustained concentration. To support your workflow, we have moved Dark Mode into production for all users. Whether you are mapping out thousands of variables or performing a final QA/QC, the high-contrast, low-light interface is designed to make deep work more enjoyable and less taxing on your vision.